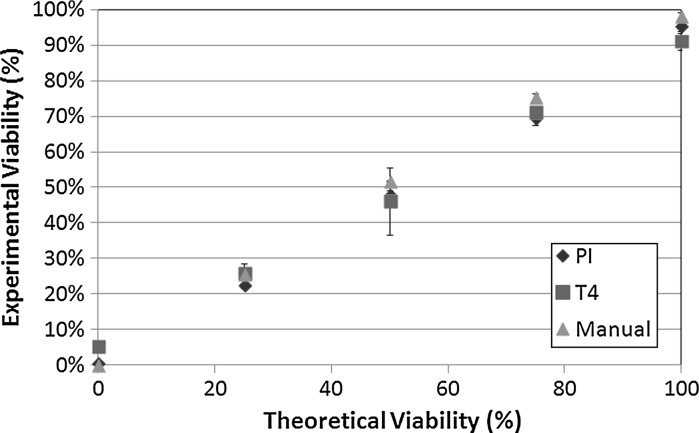
Fig. 7.
Viability comparison between manual, automated (Cellometer AutoT4) TB, and automated PI measurements of heat-killed Jurkat cells. The y-axis indicates the experimental viability percentages measured using the three described detection methods. The x-axis indicates the mixtures of fresh and heat-killed Jurkat cells to yield 0, 25, 50, 75, and 100 % theoretically viability percentages

