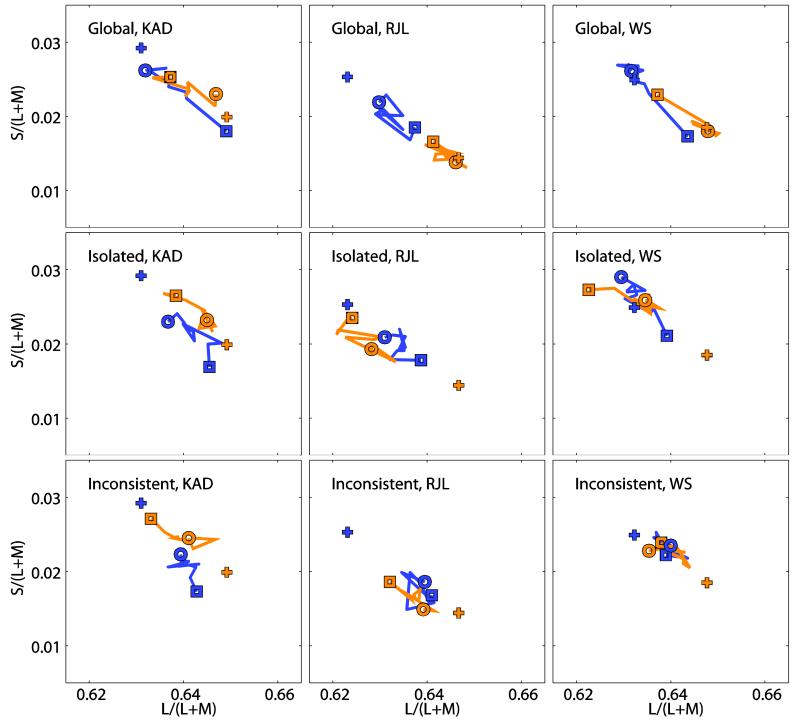
Figure 4.
Migration of the achromatic point in all experimental conditions. Each panel shows a section of the MacLeod-Boynton Chromaticity Diagram and indicates the path taken by the achromatic point as it moved following a change of illuminant from skylight to sunlight (orange lines) and sunlight to skylight (blue lines). The squares show the position measured in the trial immediately after the switch, and the circles show the position in the tenth trial after the switch. Data are shown in separate plots for each of the three observers (KAD: left column, RJL: middle column, WS: right column), in each of the three experimental conditions (global: top row, isolated: middle row, inconsistent: bottom row). The crosses show the position of the achromatic point measured in the steady-state conditions under one illuminant (orange: sunlight, blue: skylight).

