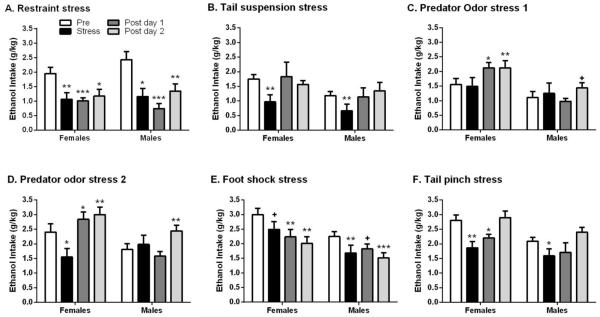
Figure 3.
Impact of environmental stressors on ethanol intake. Mean (±SEM) of 10% ethanol (10E) intake (g/kg/2hr) in female and male mice following (A) 30-min restraint (Cohort 1), (B) 6-min tail suspension (Cohort 1), (C) 30-min predator odor (Cohort 1), (D) 30-min predator odor (Cohort 2), (E) 5-min intermittent foot shock (Cohort 2), and (F) 15-min tail pinch stress (Cohort 2). Baseline is the average of the two drinking days immediately prior to the stress day. ***p<0.001, **p<0.01, *p<0.05 and +p≤0.09 vs. respective baseline intake (post hoc t-test). Cohort 1 group size was 9 (males) and 10 (females); Cohort 2 group size was 12 (males) and 12 (females).

