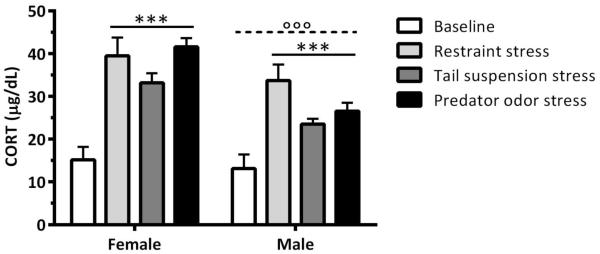
Figure 4.
Plasma corticosterone (CORT) levels following select stressors. Mean (±SEM) CORT levels (μg/dL) in female and male mice from Cohort 1 at “baseline” and following exposure to 30-min restraint, 6-min tail suspension, and 30-min predator odor. ***p≤0.001 vs. “baseline” level (ANOVA, main effect of stressor), °°°p≤0.001 vs. females (ANOVA, main effect of sex); Group size for females was 10 except for baseline where one sample was lost; Group size for males was 9.

