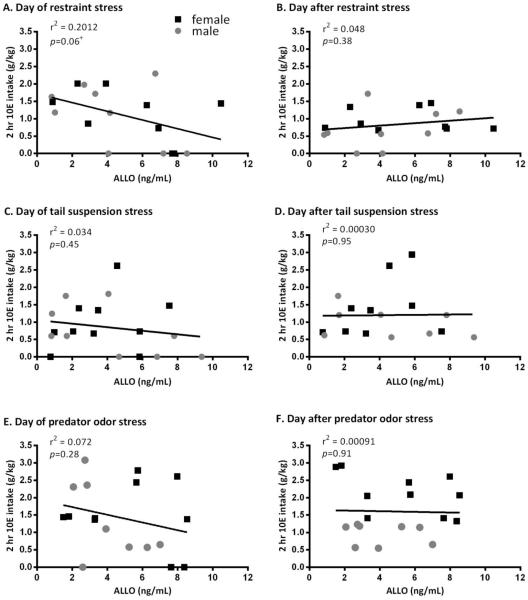
Figure 7.
Regression analysis of g/kg ethanol (10E) intake and ng/mL allopregnanolone (ALLO) levels following select stressors in Cohort 1. There was a trend toward a significant negative relationship between ALLO levels following restraint stress and 10E intake on the day of (A), but not the day after (B) administration of the stressor. The r2 value indicates that 20% of the variance in 10E intake on the day of restraint stress could be explained by ALLO levels immediately after 30 min of restraint. There was no relationship between ALLO levels following tail suspension or predator odor stress on the day of (C and E, respectively) or the day after (D and F, respectively) administration of the stressor.

