
Figure 2.
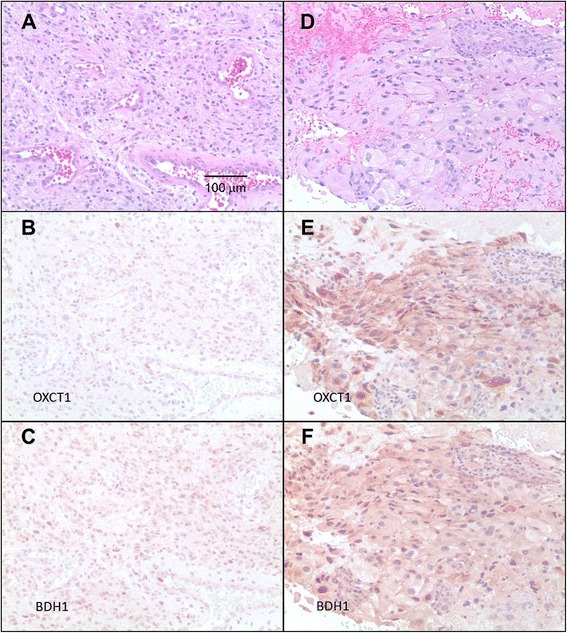
Immunohistochemistry staining for ketolytic enzymes BDH-1 and OXCT-1. (A-C) Micrographs of patient no. 1’s tumor. (A) H&E stained section. (B) Immunohistochemistry reaction shows that most cells in this region, probably tumor cells, demonstrate decreased or ‘low’ expression of OXCT-1. (C) Many cells in this same region appear positive for BDH-1. (D-F) Micrographs of patient no. 2’s tumor. (D) H&E stained section. (E) Immunohistochemistry reaction shows that most tumor cells in this region are positive for OXCT-1. (F) Most tumor cells in the same region also appear positive for BDH-1. All micrographs were taken at the same magnification (×200).