
Figure 3.
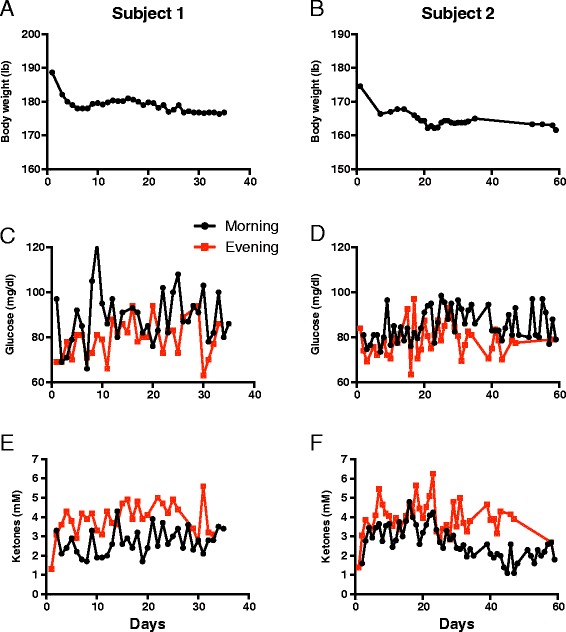
Blood glucose, ketones, and daily weights. Twice daily body weights (A, B), blood glucose (C, D) and ketones (E, F) are graphed for each day the patient was treated with ERKD. Data for patient no. 1 is depicted in the panels (A, C, E) to the left and patient no. 2 in the panels (B, D, F) to the right.