
Figure 2.
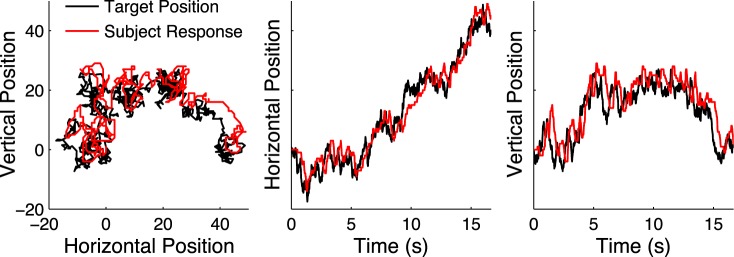
Target position and subject response for a single tracking trial (left plot). The middle and right plots show the corresponding time series or the horizontal and vertical positions, respectively.
Official websites use .gov
A
.gov website belongs to an official
government organization in the United States.
Secure .gov websites use HTTPS
A lock (
) or https:// means you've safely
connected to the .gov website. Share sensitive
information only on official, secure websites.
Target position and subject response for a single tracking trial (left plot). The middle and right plots show the corresponding time series or the horizontal and vertical positions, respectively.