
Figure 9.
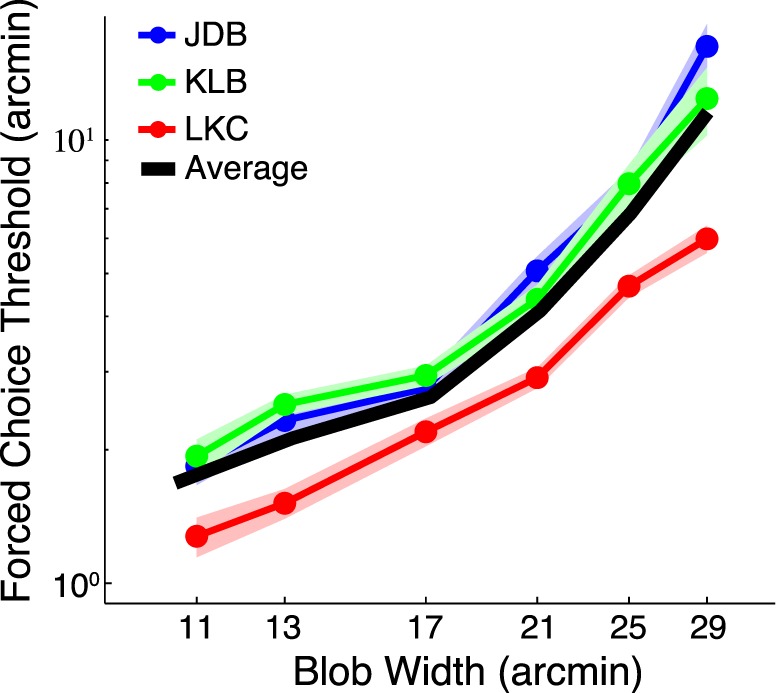
Forced-choice threshold as a function of blob width. Each subject's average data are shown by the solid points, and the bands indicate bootstrapped SEM. Both axes are logarithmic. The solid black line shows the average across subjects.
Official websites use .gov
A
.gov website belongs to an official
government organization in the United States.
Secure .gov websites use HTTPS
A lock (
) or https:// means you've safely
connected to the .gov website. Share sensitive
information only on official, secure websites.
Forced-choice threshold as a function of blob width. Each subject's average data are shown by the solid points, and the bands indicate bootstrapped SEM. Both axes are logarithmic. The solid black line shows the average across subjects.