
Figure 10.
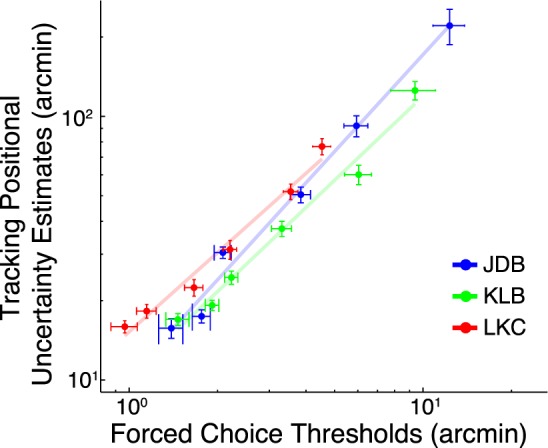
Scatter plot of the position uncertainty estimated from the tracking experiment (y axis) as a function of the thresholds from traditional psychophysics (x axis) for our three observers. The log-log slope is very close to 1 and the percentage of variance accounted for is over 96% for each observer.