
Figure 13.
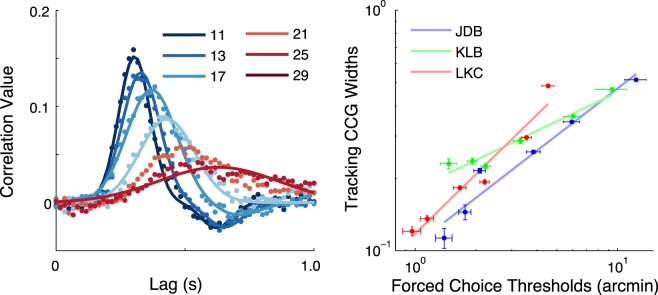
The left panel depicts the CCGs for subject LKC sorted by blob width (identified in the legend by their σ in arcmin). The right panel shows the forced-choice estimates versus the CCG widths (of the positive-going Gaussians) from the tracking data. Error bars correspond to SEM.