
Figure 5.
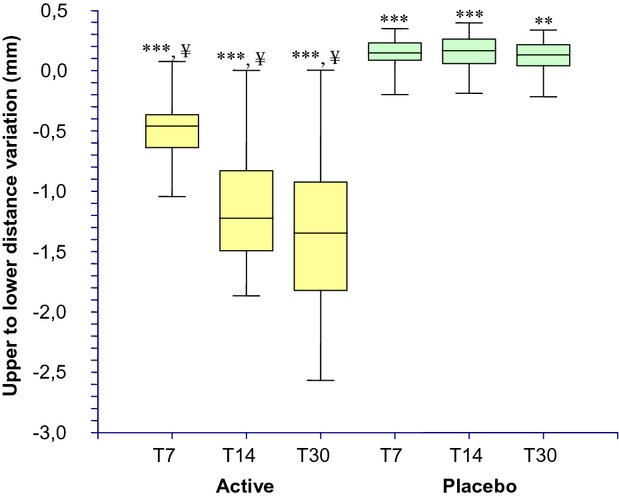
Upper to lower distance (face contour lifting effect) variation during the treatment. ***P < 0.001 vs. T0, **P < 0.01 vs. T0, ¥P < 0.001 active treatment vs. placebo. T0, baseline; T7, 7 days; T14, 14 days; T30, 30 days.
Official websites use .gov
A
.gov website belongs to an official
government organization in the United States.
Secure .gov websites use HTTPS
A lock (
) or https:// means you've safely
connected to the .gov website. Share sensitive
information only on official, secure websites.
Upper to lower distance (face contour lifting effect) variation during the treatment. ***P < 0.001 vs. T0, **P < 0.01 vs. T0, ¥P < 0.001 active treatment vs. placebo. T0, baseline; T7, 7 days; T14, 14 days; T30, 30 days.