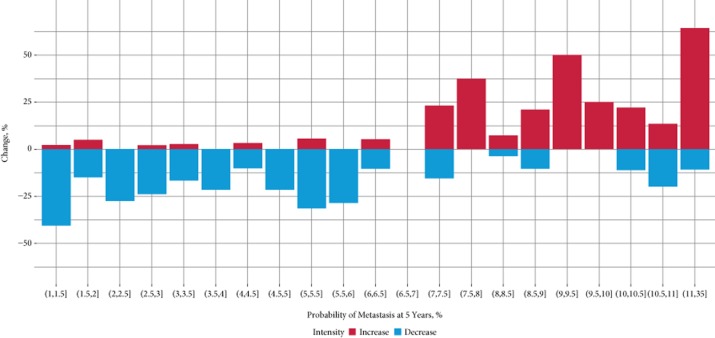
Figure 4.
Treatment plan intensity waterfall plot by risk of metastasis at 5 years after radical prostatectomy, according to the genomic classifier (GC) test, across all reviewed patient case histories. Treatment intensity levels were ranked from lowest to highest as follows: observation, adjuvant radiation therapy (ART), ART+ hormone therapy (HT), and HT. The x-axis indicates the 5-year probabilities of metastasis (%) according to the GC test results and the y-axis indicates the percentage of change in treatment intensity with knowledge of the GC test results (%).

