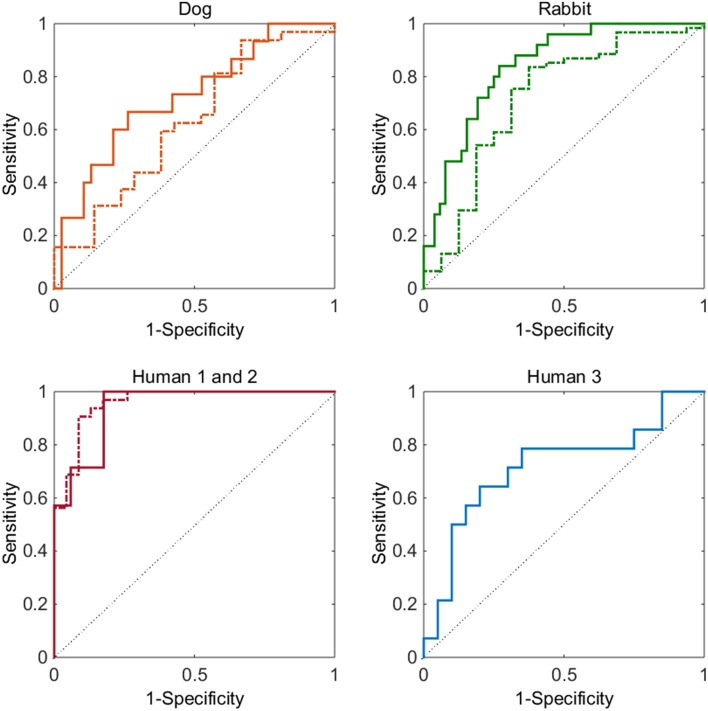
Figure 1.
Top left graph, dog data-set: ROC curve for prolongation (solid line) and for shortening (dashed line). Top right graph, rabbit data-set: ROC curve for prolongation (solid line) and for shortening (dashed line). Bottom left graph: ROC curve for Torsades de Pointes risk for the human 1 (dashed) and human 2 (solid) data-sets. Bottom right graph: ROC curve for QTc prolongation for the human 3 data-set (solid). In all graphs the thin solid line represents a ROC curve of random chance.

