Table 1.
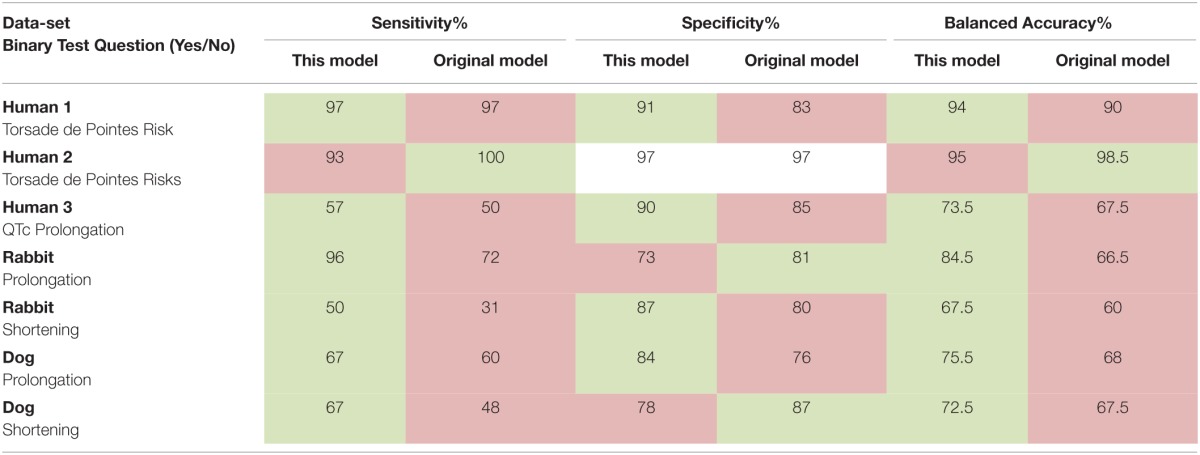
Sensitivity, specificity, and balanced accuracy of our model compared with the original models' predictions.

Better metrics are highlighted in green. Worse metrics are highlighted in red.
Sensitivity, specificity, and balanced accuracy of our model compared with the original models' predictions.

Better metrics are highlighted in green. Worse metrics are highlighted in red.