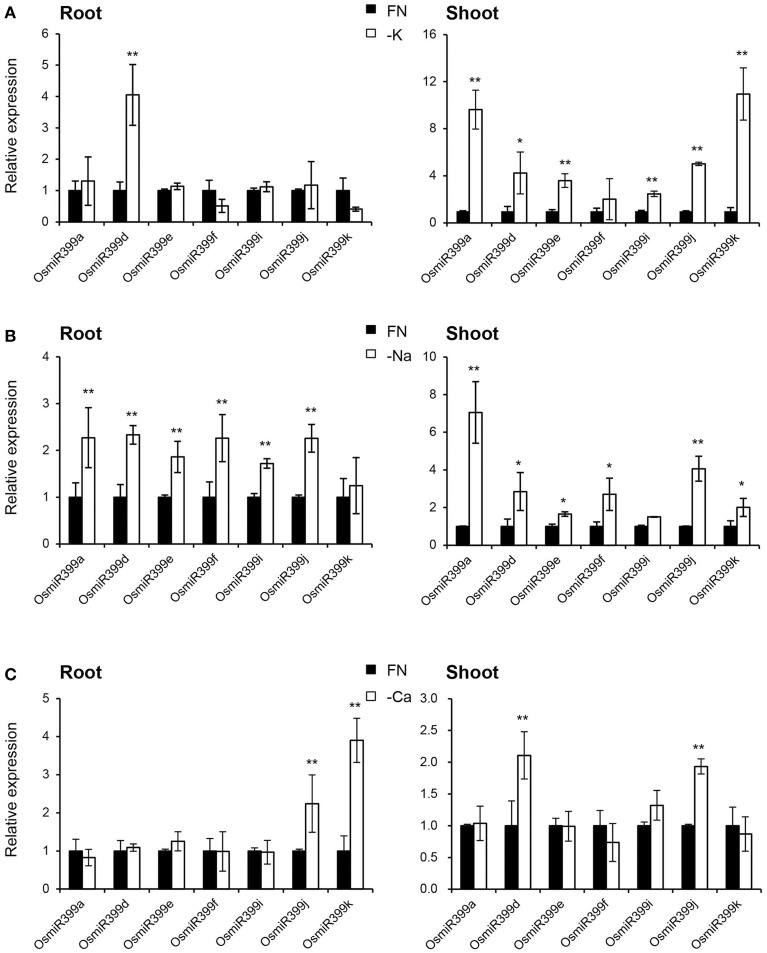
Figure 5.
OsmiR399s were induced by K, Na or Ca starvation. (A) The transcript expression assay of OsmiR399 under K starvation (-K). (B) The transcript expression assay of OsmiR399 under Na starvation (-Na). (C) The transcript expression assay of OsmiR399 under Ca starvation (-Ca). The expression of seven OsmiR399 members (OsmiR399a, OsmiR399d, OsmiR399e, OsmiR399f, OsmiR399i, OsmiR399j, OsmiR399k) were examined by analyzing the expression of their precursors (pri-miRNA). FN, full nutrition condition. The transcript expression was determined by qRT-PCR. Values are the means ± SD (n = 3). The asterisks indicate the significant difference determined by student t-test: *P < 0.05, **P < 0.01. The transcript expression of OsmiR399 under FN was set as 1.

