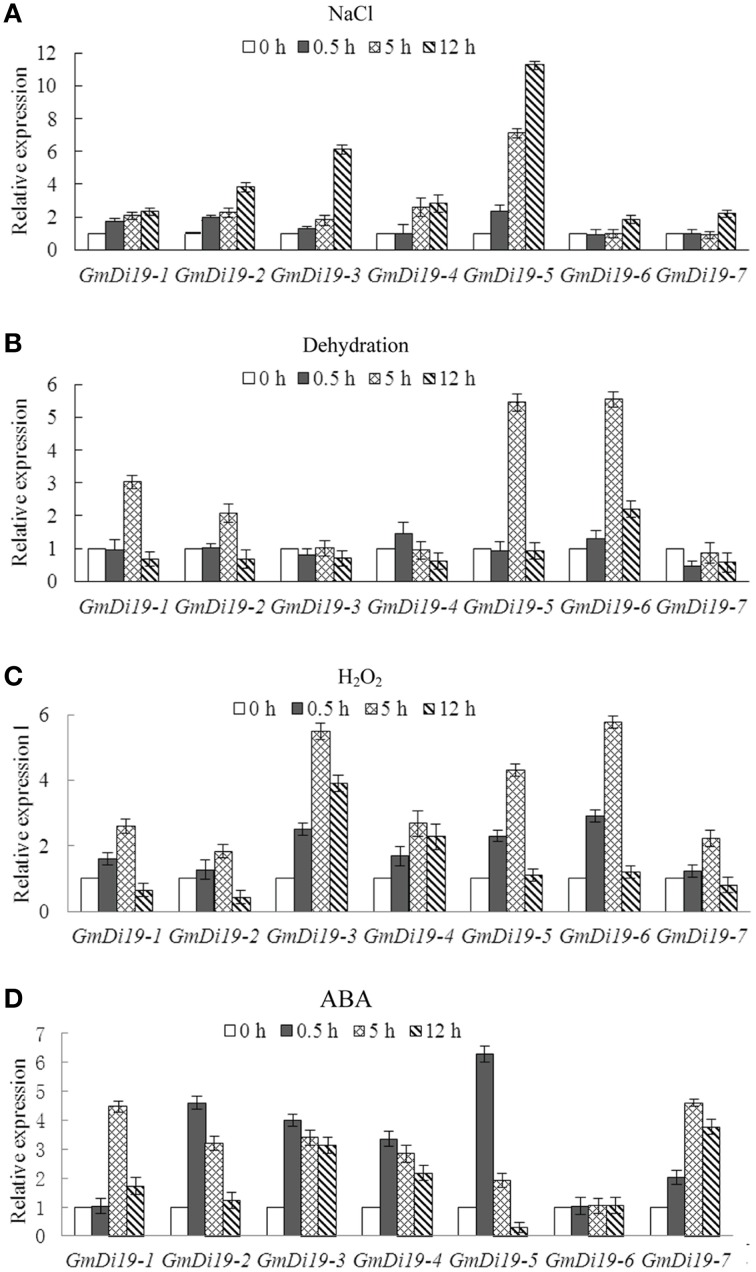
Figure 4.
Relative expression profiles of the Di19 genes in the 2-week-old soybean seedlings subjected to NaCl (A), dehydration (B), H2O2 (C), and ABA (D) stress treatments. The transcript levels of each Di19 in the stress-treated plants were plotted as the relative expression (fold) of the non-stressed control plants for 0.5, 5, and 12 h. The transcript level of Actin was used as a reference. Mean values and standard errors (bar) were shown from three independent experiments.

