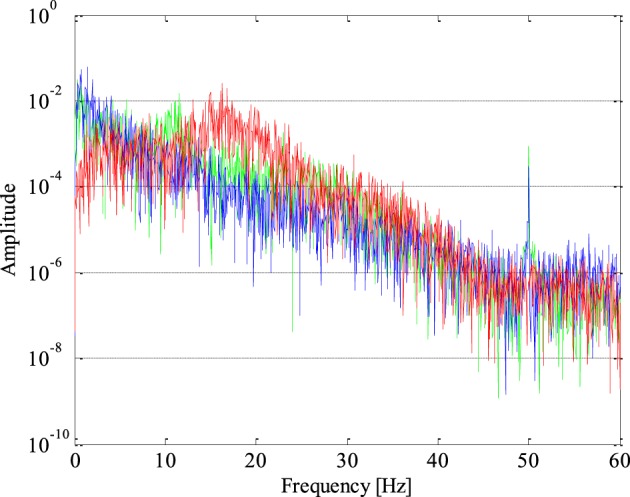
Figure 4.

Periodogram of epileptic (in red) and non-epileptic (unhealthy in blue and healthy tissue in green) segments of EEG signals where a shift in the EEG signal power from lower to higher frequencies in the presence of epileptiform activity is evident.
