Figure 2.

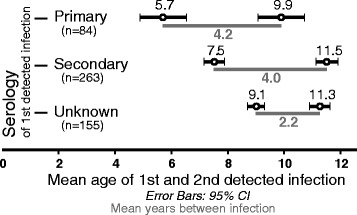
Mean age at infection one and infection two (with 95% CIs) along with the mean time interval between infections grouped by serologic response at infection one.

Mean age at infection one and infection two (with 95% CIs) along with the mean time interval between infections grouped by serologic response at infection one.