
Figure 4.
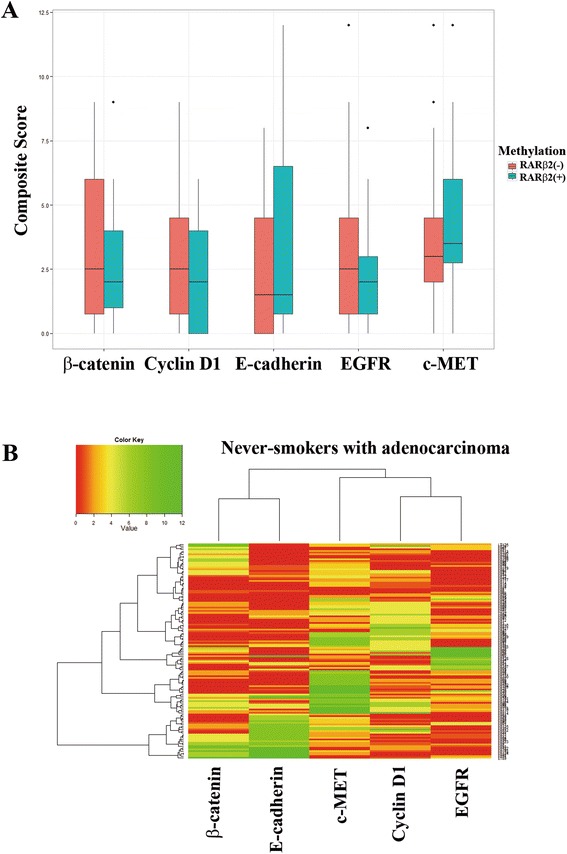
Unsupervised clustering of protein expression in 128 never-smokers with adenocarcinoma. (A) Boxplots of composite scores of each of the five proteins. Composite scores of the expression levels of the five proteins were compared according to methylation status of RARβ2. Salmon and dark turquoise bars indicate groups with and without RARβ2 hypermethylation, respectively. Outliers are represented by black dots. (B) The hierarchical clustering of the expression patterns of the five proteins is shown. The scaled composite score of individual proteins is plotted in a red-green scale, with red indicating low expression and green indicating high expression. Each row represents individual tissues and each column represents the five proteins. The color in each cell reflects the expression levels of individual proteins in the corresponding tissue.