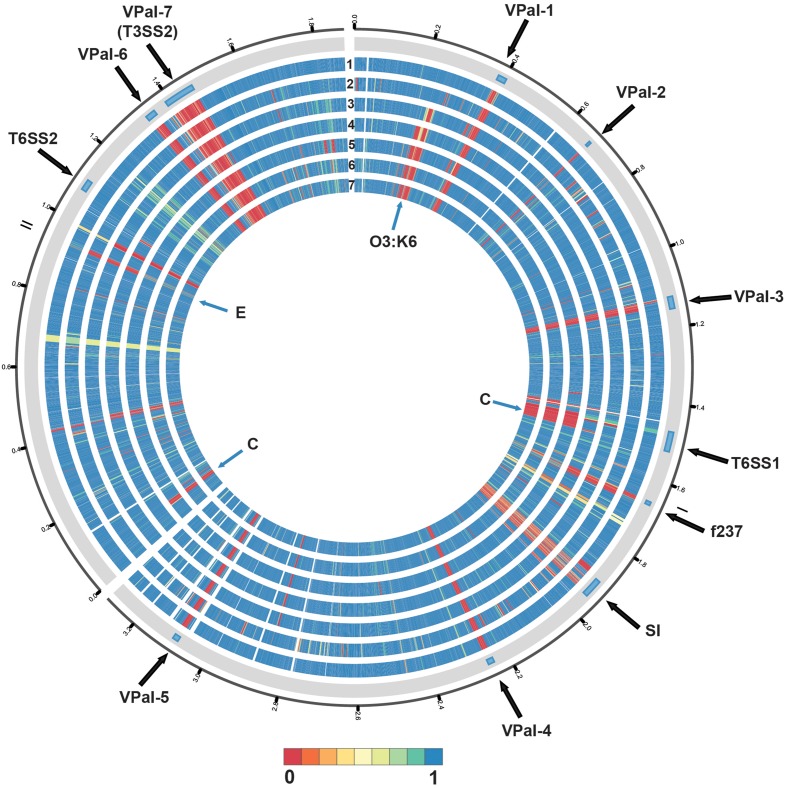
Figure 3.
Circular display of the BLASTN BSR values demonstrating the genetic similarity of each gene of RIMD2210633 in the genome of the pre-1995 O3:K6 isolate AQ4037 (Chen et al., 2011), and the genomes sequenced in this study. The previously described putative pathogenicity islands (Hurley et al., 2006) and other regions of interest (Chen et al., 2011) in the genome of RIMD2210633 (Makino et al., 2003) are indicated in the outermost track. The genomes in tracks labeled 1–7 are as follows: (1) AF91, (2) AQ4037, (3) K1275, (4) K1461, (5) SG176, (6) J-C2-34, and (7) 22702. The location of the O3:K6 O-antigen lipopolysaccharide region is indicated by “O3:K6.” An “E” designates the location of RIMD2210633 genes that are present with greater similarity in the environmental isolate genomes than in the clinical isolate genomes. A “C” designates the location of RIMD2201633 genes that are present in the clinical isolate genomes analyzed and not in the environmental isolate genomes, with the exception of AF91. The circular display of the BSR values was generated using Circos (Krzywinski et al., 2009). Blue indicates genes were present with significant similarity, yellow indicates the genes were present but divergent, and red indicates genes were absent.

