
Figure 1.
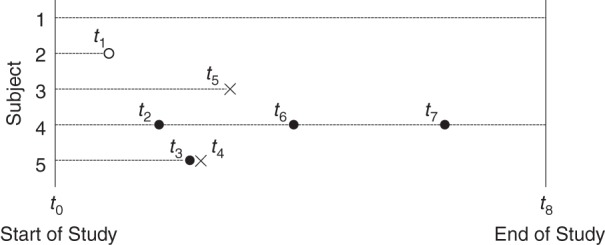
A visual representation of a hypothetical study that has a recurrent-event outcome. A dashed line represents the follow-up period of each individual. A solid circle represents the occurrence of the event of interest, an open circle represents censoring, and a cross represents the occurrence of the competing-risk event.