Fig. 1.
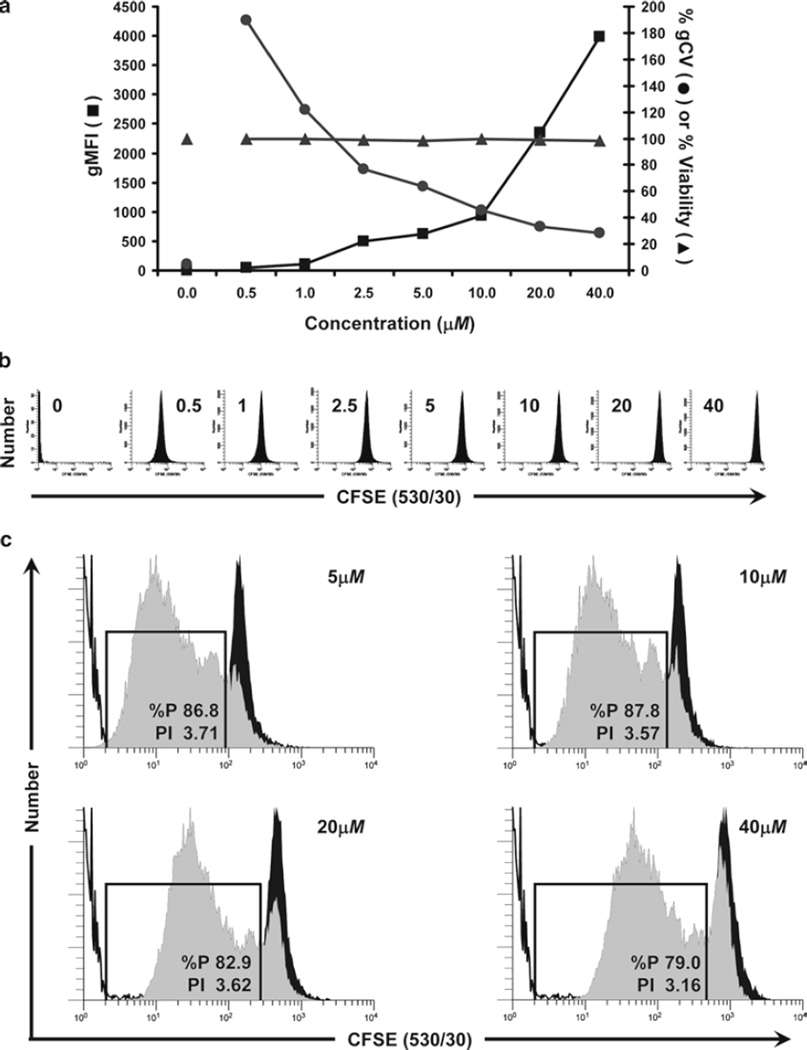
Considerations for optimization of hPBMC staining with CFSE. The optimal concentration for any tracking dye is that which yields cells that are as brightly and homogeneously stained as possible, while also exhibiting good viability, unaltered cell function, and the ability to compensate adequately for color overlap with other probes to be used. In this study, the maximum tolerated concentration of CFSE was determined for hPBMC isolated from peripheral blood, labeled as described in Subheading 3.1 (final concentrations: 5 × 10⁷ cells/mL and 0.5–40 µM CFSE) and analyzed by flow cytometry immediately upon completion of staining (T0). (a) The relationships between dye concentration, initial staining intensity (geometric mean fluorescence intensity; gMFI), peak width (calculated as % gCV = geometric SD/gMFI × 100), and viability (% of cells able to exclude trypan blue) are shown. Viability was minimally affected at all concentrations of CFSE tested. Increasing CFSE concentrations led to increasing intensities (gMFI) and decreasing peak widths (gCV). (b) Individual histograms for each test sample shown in (a) were collected at a constant CFSE detector voltage, which was set so that the 40-µM sample remained fully on scale in the last decade. Note that at this voltage, unstained cells were not fully on scale in the first decade. (c) Samples stained with the indicated concentrations of CFSE were cultured in the presence of anti-CD3 and anti-CD28 for 4 days (gray histograms) and compared to controls that were CFSE stained but unstimulated (black histograms) or unstained (unfilled histograms) to determine the effect of CFSE concentration on proliferative potential (see Subheading 3.4.5 for description of methods for quantifying the extent of proliferation). Although post-staining viabilities were similar at all concentrations (Fig. 1a), both the proliferative fraction (% proliferating cells; %P) and the proliferative index (fold increase in cell number; PI) decreased at the highest concentration (40 µM) and %P also decreased at 20 µM, indicating that some inhibition of proliferation was occurring at higher concentrations of CFSE.

