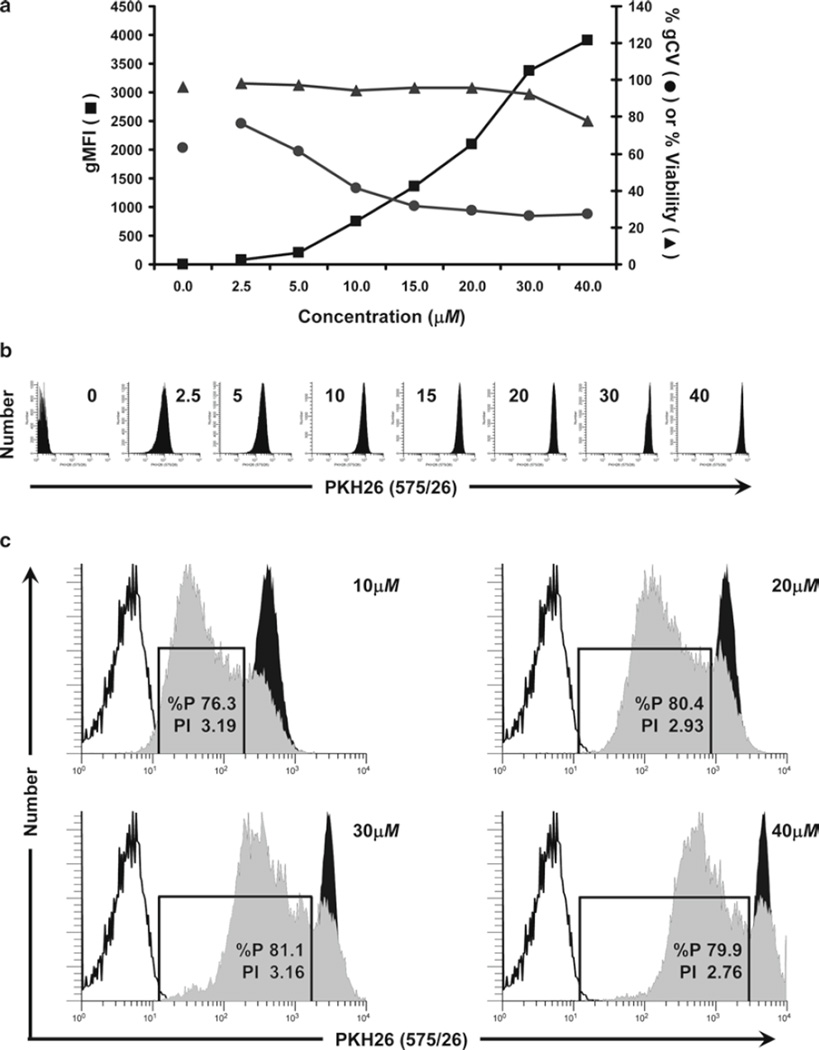
Fig. 3.
Considerations for optimization of hPBMC staining with PKH26. In this study, monocyte-depleted lymphocytes isolated from TRIMA filters (Subheading 3.4.1) were labeled with the indicated concentrations of PKH26 in Diluent C as described in Subheading 3.2 (final cell concentration: 5 × 10⁷/mL) to determine the maximum tolerated concentration. Cells were analyzed by flow cytometry immediately upon completion of staining (T0). (a) The effect of PKH26 concentration on staining intensity, CV, and viability was determined in a titration study similar to that described in Fig. 1a. Viability was minimally affected at concentrations up to 30 µM but decreased at 40 µM, most likely due to the ethanol vehicle present in the 1-mM PKH26 dye stock (final concentration in staining step: 4% at 40 µM). As with CFSE, increasing PKH26 concentrations yielded increasing fluorescence intensities and decreasing peak widths. (b) Individual histograms for each test sample shown in (a) were collected at a constant PKH26 detector voltage, which was set so that the 40-µM sample remained fully on scale in the last decade. Note that at this voltage, unstained cells were mostly on scale in the first decade. (c) Samples stained with the indicated concentrations of PKH26 were cultured in the presence of anti-CD3 and anti-CD28 for 4 days (gray histograms) and compared to unstimulated stained (black histograms) and unstained controls (unfilled histograms). The proliferative fraction (%P) was essentially identical at the three highest concentrations but slightly lower at the lowest concentration (10 µM) due to the overlap of highly proliferated cells with the unstained cell region. Proliferative index (PI) was somewhat reduced at the highest PKH26 concentration (40 µM), suggesting that the rate of expansion had decreased and that the proliferative potential as well as viability had been compromised.

