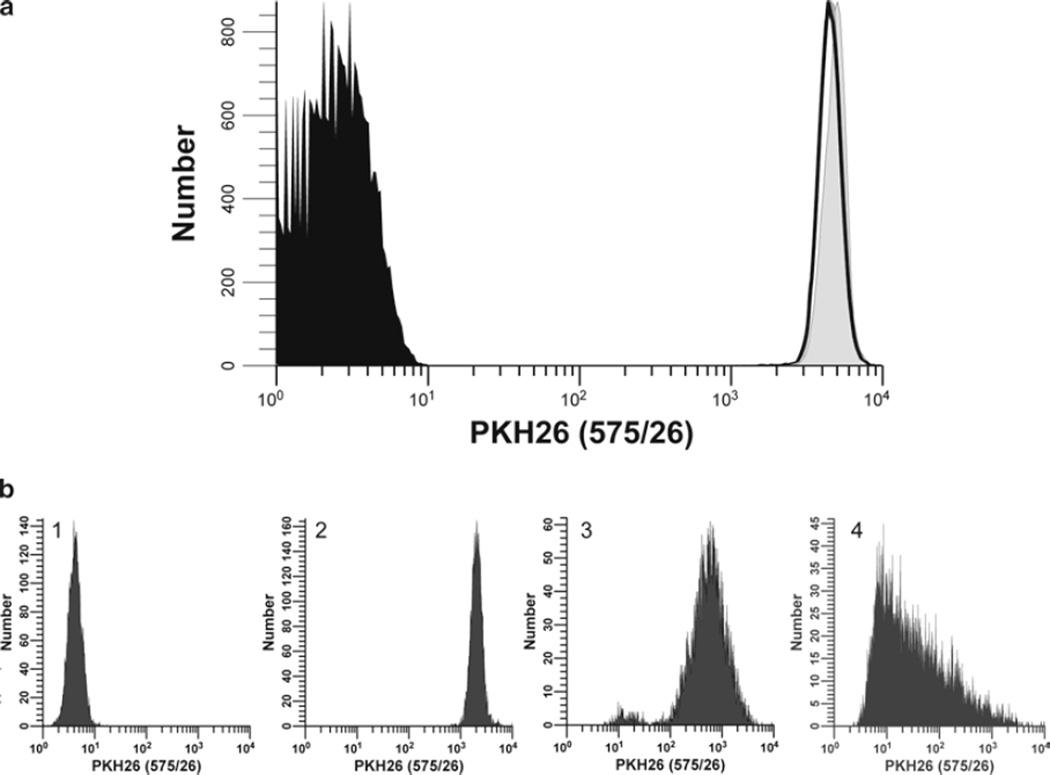
Fig. 4.
Additional factors affecting intensity and heterogeneity of PKH26 staining. (a) Stability of PKH26 intensity during the first 24 h of culture and after fixation. hPBMC isolated from peripheral blood were prepared and labeled with PKH26 in Diluent C as described in Subheading 3.2 (final concentrations: 5 × 10⁷ cells/mL, 10 µM PKH26). Unfixed samples were analyzed immediately post-staining (T0) (filled gray histogram; gMFI = 4,874, gCV = 16.0%) and after 24 h in culture (T24) at 37°C without stimulus; either unfixed (unfilled histogram, gray line; gMFI = 4,557, gCV = 17.9%) or fixed in 2% methanol-free formaldehyde (unfilled histogram, black line; gMFI = 4,536, gCV = 17.6%). Data were collected on an LSR II flow cytometer using a lymphocyte scatter gate, and with PKH26 detector voltage set so that the unfixed T0 sample remained fully on scale in the last decade and the unstained control mostly on scale in the first decade. In contrast to CFSE (Fig. 2a), intensity and distribution differences between T0 and T24 fixed and unfixed samples were minimal. (b) Effect of staining conditions on PKH26 fluorescence distributions. Replicate samples of logarithmically growing, cultured U937 cells were stained with PKH26 (final concentrations: 1 × 10⁷ cells/mL, 12.5–15 µM PKH26) for 3 min at ambient temperature, with or without trituration after addition of 2× cells to 2× dye (see Subheading 3.2 and Notes 29–31). Stained cells were washed and then analyzed on a CyAn flow cytometer using constant instrument settings (HV = 547). Histogram 1: unstained control with PKH26 detector voltage adjusted to place all cells on scale in the first decade, with few/no cells accumulating in the first channel. Histogram 2: staining with 15 µM dye by addition of 2× cells to 2× dye with immediate trituration resulted in a bright, homogenously stained symmetrical population of cells placed in the fourth decade, with no cells accumulating in the last channel (gMFI = 2,548, gCV = 26.2%). Histogram 3: staining with 15 µM dye by addition of 2× cells to 2× dye without immediate trituration resulted in a reduced intensity and a broader CV (gMFI = 505, gCV = 116%) as well as a dimly stained subpopulation, possibly due to a drop of cells dispensed down the wall of the tube and not well-mixed with the final staining solution. Histogram 4: a staining error led to 3 µL of concentrated ethanolic dye stock being added directly to 2× cells in Diluent C without further trituration rather than being used to prepare a 2× dye solution in Diluent C. This resulted in a final dye concentration of 12 µM but yielded extremely dim and heterogenous staining (gMFI = 32.9, gCV = 1,020%). The observed right skewing most likely reflects poor mixing due to the combined effects of widely disparate cell and dye volumes, lack of trituration, and the fact that cells closest to the dye-dispensing point would be exposed to a higher concentration of dye than those farther away.

