
Figure 1.
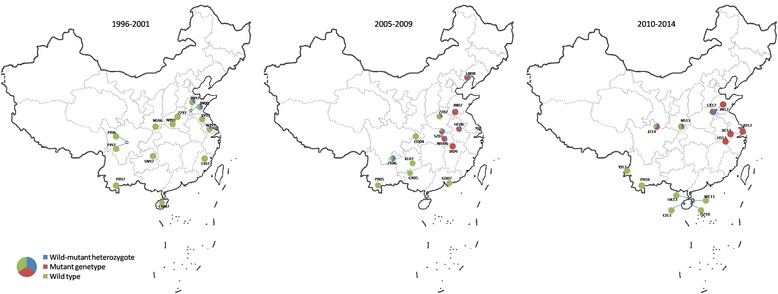
A schematic map of sampling sites for Anopheles sinensis in China and the composition of the kdr genotypes in the samples in the three time intervals, 1996–2001, 2005–2009 and 2010–2014. The genotype composition in each location was displayed by a pie chart with blue as wild/mutant heterozygote, red as mutant genotype and green as wildtype genotype (see Additional file 2: Table S2 for details).