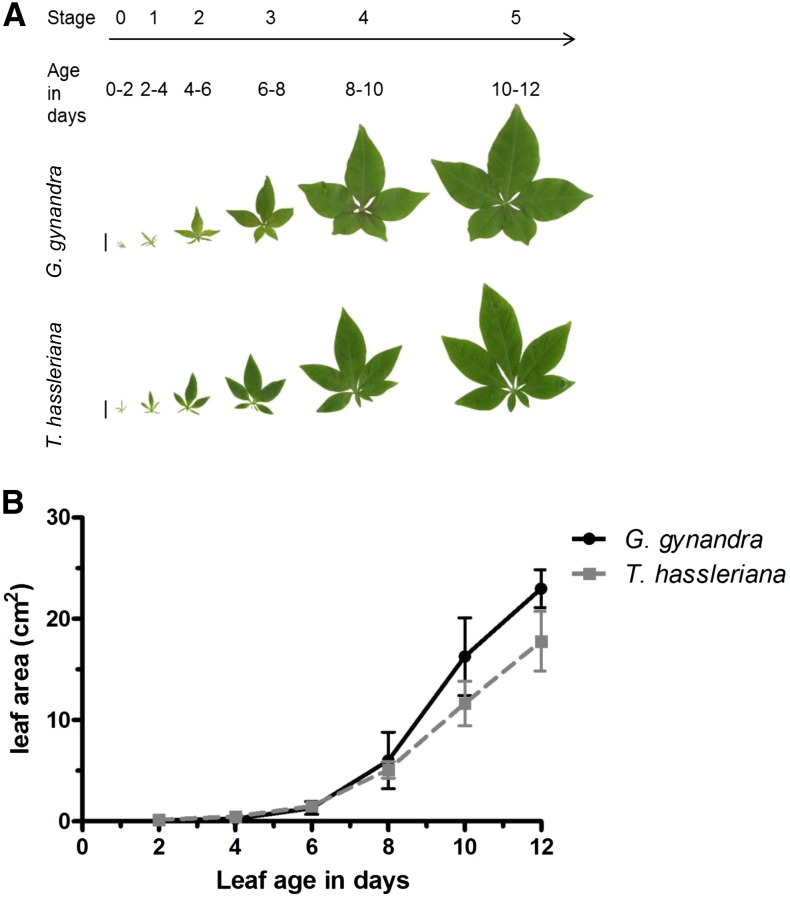
Figure 1.
Overview of Leaf Shape and Expansion Rate in G. gynandra and T. hassleriana.
(A) Image of each leaf category sequenced (bar = 1 cm). Each category is 2 d apart from the other.
(B) Leaf expansion rate of each leaf category in cm2 over 12 d (n = 5; ±sd)
[See online article for color version of this figure.]

