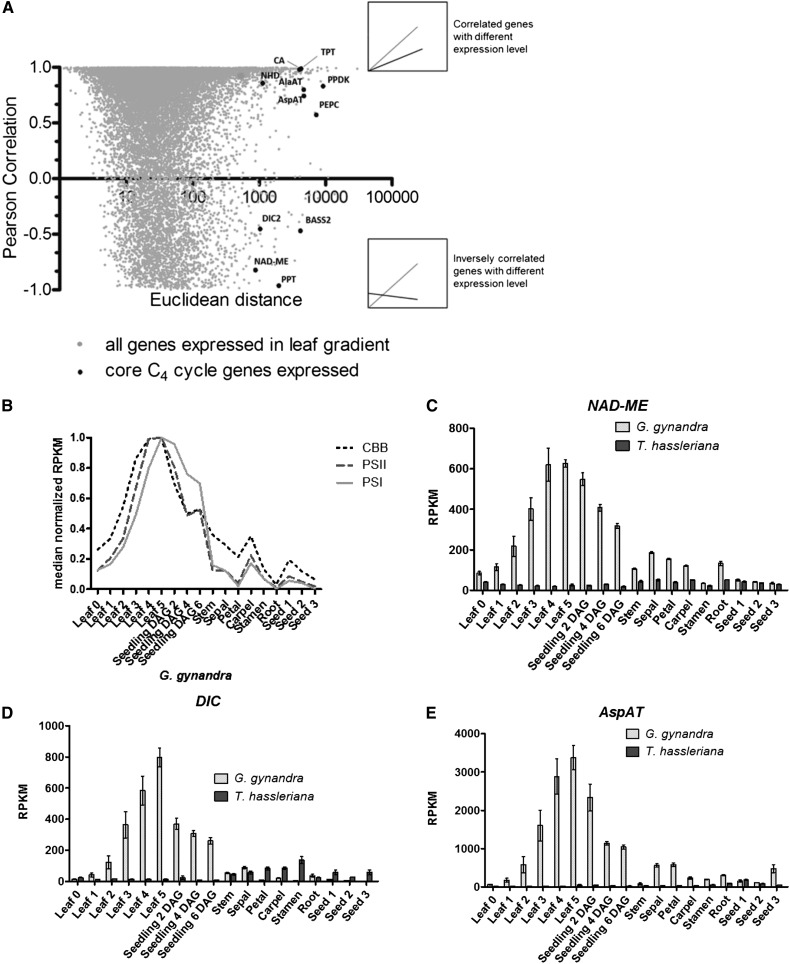
Figure 4.
Comparison of Gene Expression Dynamics within the Leaf Gradient of Both Species.
(A) Euclidean distance versus Pearson’s correlation of average RPKM (n = 3) of genes expressed (>20 RPKM) in both leaf developmental gradients. Comparison of gene expression by similarity of expression pattern and expression level in T. hassleriana and G. gynandra. Relevant highly expressed C4 cycle genes are marked in plot. Above inset shows an example of two highly correlated genes by expression trend and strength. Lower inset shows an example of two genes inversely correlated with different expression level.
(B) Expression pattern across the atlas of averaged relative expression of transcripts encoding for photosystem I (PSI), photosystem II (PSII), and soluble enzymes of the Calvin-Benson-Bassham (CBB) cycle in G. gynandra.
(C) to (E) Average expression pattern of highest abundant ortholog of C4 cycle genes (NAD-ME, DIC, and AspAT) in photo- and heterotrophic tissues in G. gynandra (light gray) and T. hassleriana (dark gray); ±se, n = 3.

