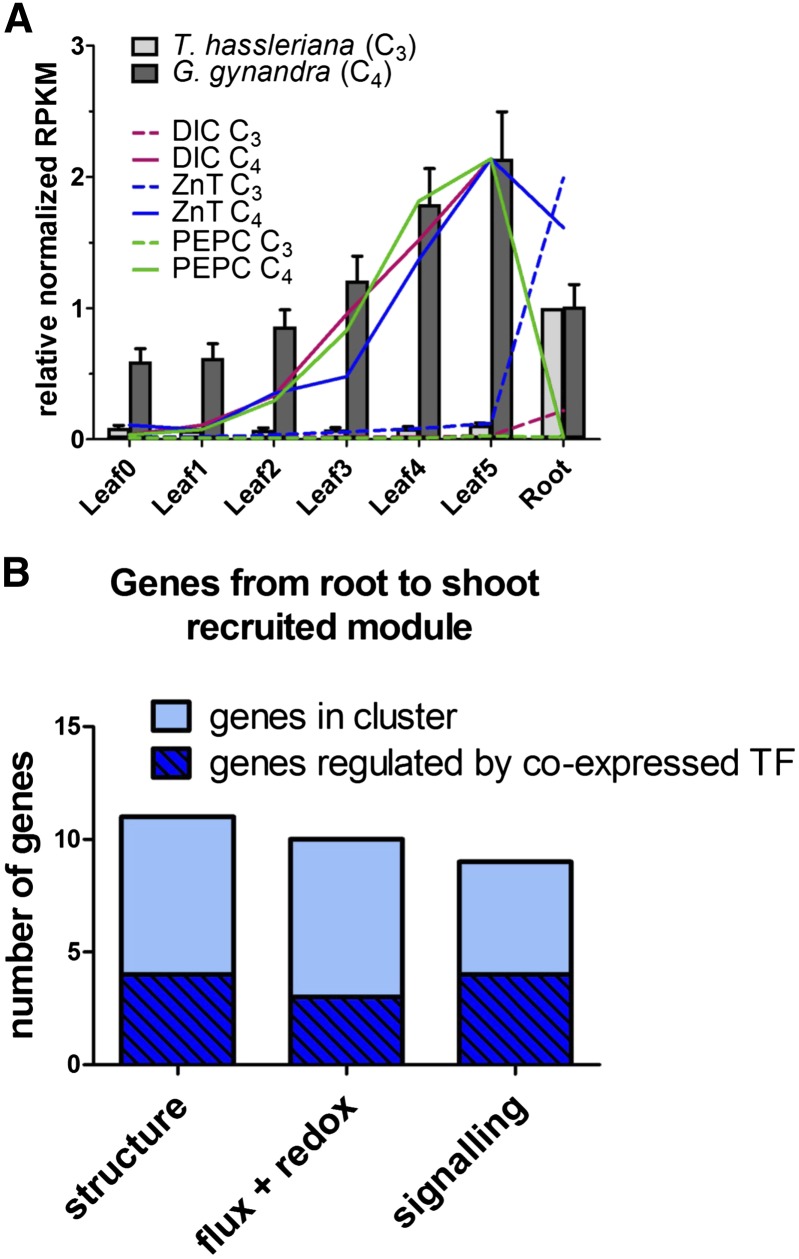
Figure 5.
Recruitment of Genes from the Root to Leaf Expression Domain in the C4 Plant G. gynandra.
(A) Relative average RPKM normalized to expression in G. gynandra leaf 5 (gray bars). Bars represent the arithmetic means of all 37 genes; lines show expression patterns of a reference C4 cycle gene (PEPC) and of two genes found in the shifted module.
(B) Genes in the module displayed as functional groups. Light blue: absolute number of genes in the group. Dark blue overlay: portion of genes controlled by a transcription factor of the module.

