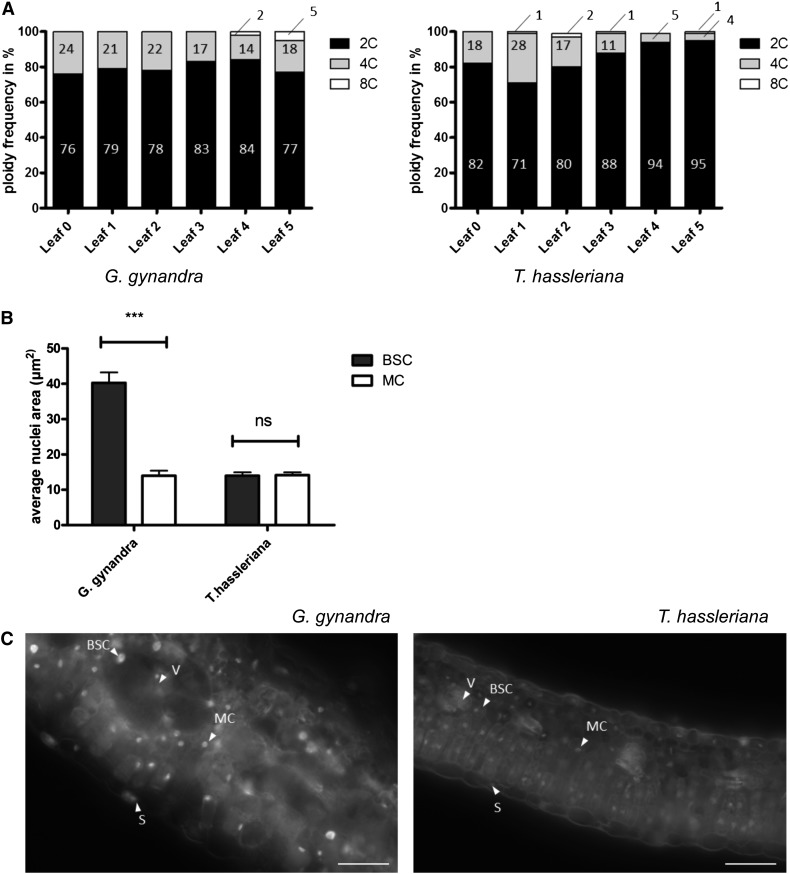
Figure 6.
Distribution of Ploidy Levels during Leaf Development and Nuclei Area of BSC and MC between G. gynandra and T. hassleriana.
(A) Ploidy distribution of developing leaf (category 0 till 5) in percentage in G. gynandra and T. hassleriana. Measurements performed in n = 3 (except G0 = 1 replicate). For each replicate, at least 2000 nuclei were measured by flow cytometry.
(B) Quantification of BSC and MC nuclei area in cross sections (n = 3 ± se) of mature G. gynandra and T. hassleriana leaves (stage 5). Area of nuclei in µm2 with at least 150 nuclei analyzed per cell type per species per replicate. Asterisks indicate statistically significant differences between BSC and MC (***P value < 0.001); n.s., not significant.
(C) Fluorescence microscopy images of propidium iodide-stained leaf cross sections (stage 5) of T. hassleriana (left) and G. gynandra (right). Arrowheads point to nuclei of the indicated cell type. V, vein; S, stomata. Bar = 50 μm.

