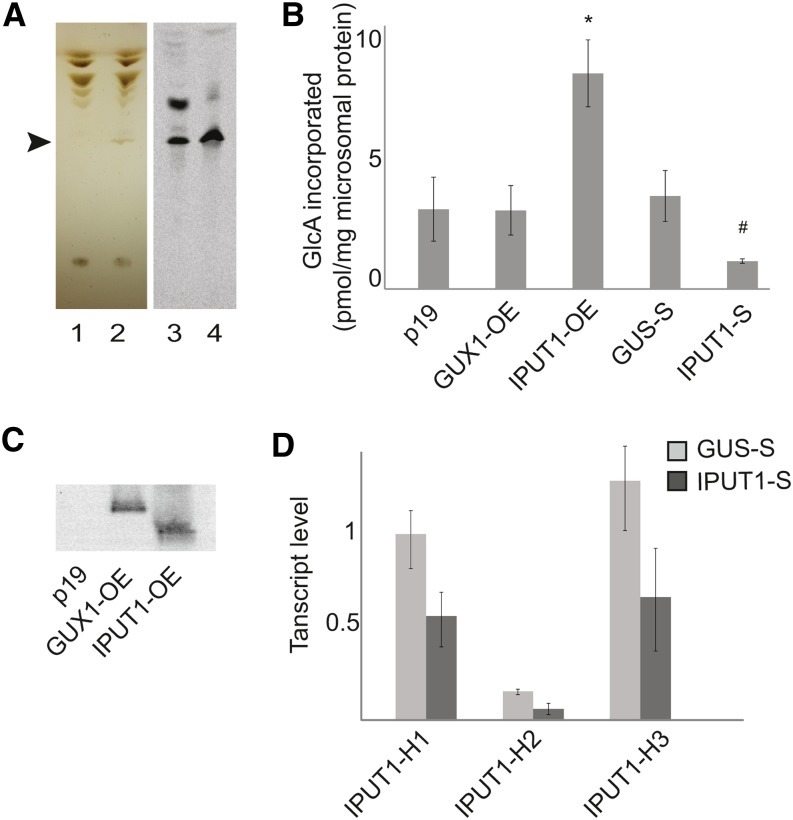
Figure 3.
Assay for IPC Glucuronosyltransferase Activity in N. benthamiana.
(A) TLC of lipids extracted from sur1Δ yeast with empty vectors (1) or vectors with UGD2, hUGTrel7, and IPUT1 (2). GlcA-IPC is indicated by the arrowhead. Radiolabeled lipids from N. benthamiana microsomes incubated with UDP-[14C]GlcA followed by mock (3) or mild alkaline hydrolysis treatment (4) were developed on the same TLC plate.
(B) Incorporation of radiolabel into GlcA-IPC bands produced from microsomes prepared from N. benthamiana plants expressing p19 (control), overexpressing GUX1 (GUX-OE) or IPUT1 (IPUT1-OE), or plants silencing the control gene GUS (GUS-S) or IPUT1 (IPUT1-S). *, Significantly different from p19 (t test, P < 0.05); #, significantly different from GUS-S (t test, P < 0.05).
(C) Immunoblot of microsomal proteins from N. benthamiana plants expressing p19 or overexpressing GUX1 (GUX-OE) or IPUT1 (IPUT1-OE).
(D) Expression levels of N. benthamiana IPUT1 homologs H1, H2, and H3 in IPUT1-silenced plants. All transcript levels were normalized to ACT2, UBI, and EF1α. Values shown are normalized to the transcript level of IPUT1-H1 in GUS-silenced plants. All values are the mean ± se of three biological replicates.
[See online article for color version of this figure.]

