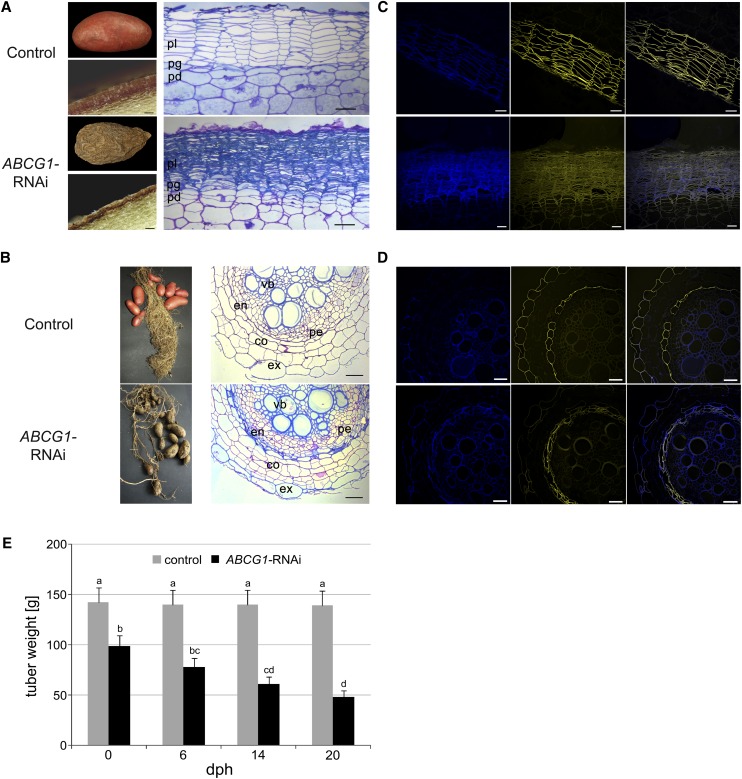
Figure 4.
Morphological Alterations in ABCG1-RNAi Plants.
(A) Tuber phenotype of wild-type (top panel) and ABCG1-RNAi (bottom panel) plants. Tubers were harvested from greenhouse-grown potato plants and analyzed after 1 week of storage at 4°C (left). Microscopy of cross sections of wild-type and ABCG1-RNAi tubers is shown on the right. pl, phellem; pg, phellogen; pd, phelloderm. Bars = 80 μm.
(B) Root phenotype of wild-type (top panel) and ABCG1-RNAi (bottom panel) plants. Microscopy of cross sections of empty vector and ABCG1-RNAi roots is shown on the right. ex, exodermis; co, cortex; en, endodermis; vb, vascular bundle; pe, pericycle.
(C) Reduced suberin staining of tuber periderm of wild-type (top panel) and ABCG1-RNAi (bottom panel) plants. Cross sections of potato tuber periderm were stained with fluorol yellow and subjected to fluorescence microscopy (left, autofluorescence; middle, fluorol yellow; right, merged). Bars = 50 μm.
(D) Reduced suberin staining of the root exodermis of wild-type (top panel) and ABCG1-RNAi (bottom panel) plants. Cross sections of roots were stained with fluorol yellow and subjected to fluorescence microscopy (left, autofluorescence; middle, fluorol yellow; right, merged). Bars = 50 μm.
(E) Tuber weight loss of ABCG1-RNAi plants. Tubers were harvested from greenhouse-grown control (gray bars) and ABCG1-RNAi plants (black bars) and stored at room temperature. Tuber weight was determined at the time points indicated (n = 41, three independent experiments, two independent RNAi lines, days postharvest [dph]). Error bars represent se. Letters indicate statistically different values (two-way ANOVA, bP ≤ 0.05, c,dP ≤ 0.01).

