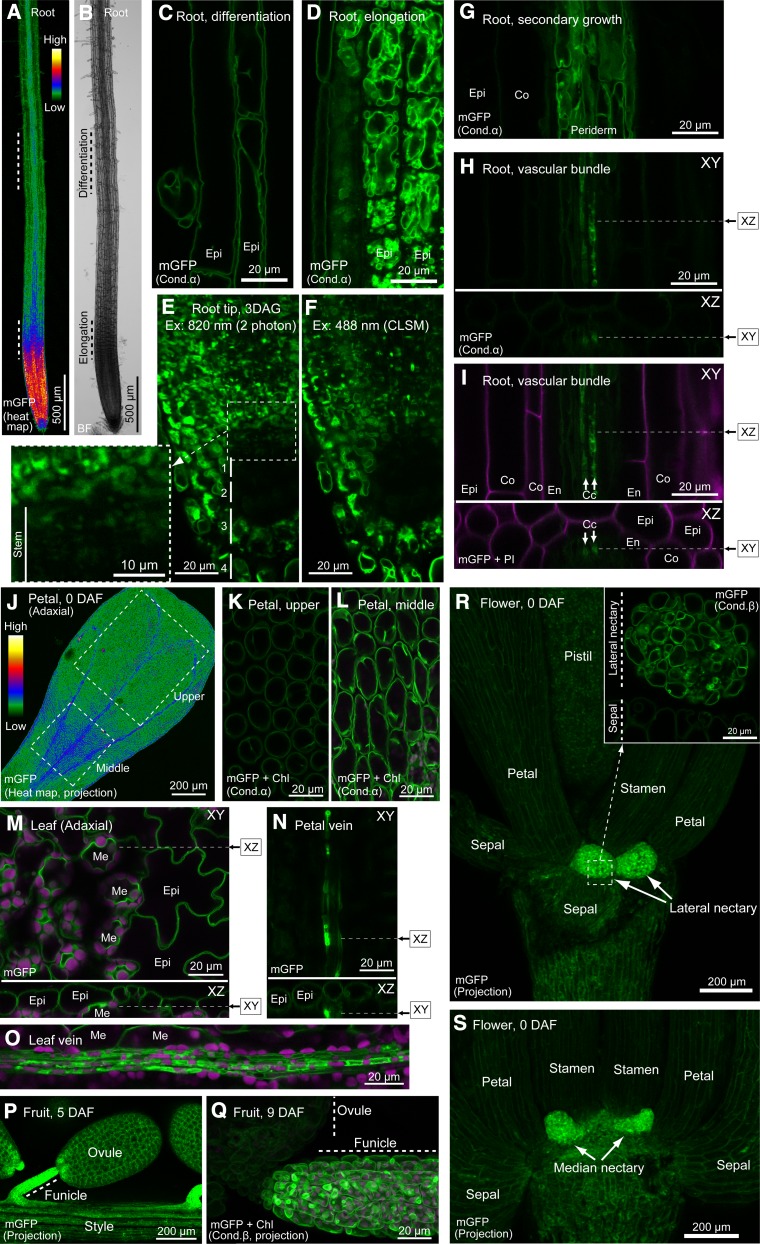
Figure 10.
Imaging of VHP1-mGFP in Various Tissues.
(A) Heat map of a root.
(B) Bright field image of (A).
(C) Epidermal cells in root differentiation region.
(D) Epidermal cells in root elongation region.
(E) and (F) Root tip of 3-DAG seedling analyzed by two-photon microscopy (E) and CLSM (F).
(G) Root vascular bundle during secondary growth.
(H) and (I) Vascular bundle of young root. Arrows indicate phloem companion cells.
(J) Heat map of adaxial side of petal at 0 DAF.
(K) Epidermal cells of petal upper region.
(L) Epidermal cells of petal middle region.
(M) Adaxial side of rosette leaf.
(N) Abaxial side of petal, focused on vein.
(O) Abaxial side of rosette leaf. To obtain the vein image, the epidermal layer was peeled off.
(P) Ovule and funicle in 5-DAF fruit.
(Q) Ovule and funicle in 9-DAF fruit.
(R) Bottom of 0-DAF flower. Magnified figure of dashed square is shown at upper right.
(S) Basal region of a flower at 0 DAF.
All mGFP images were obtained by CLSM, except (E), which was obtained by two-photon microscopy. XZ image in (H), (I), (M), and (N) was constructed by Z stacking along the dashed line. (J), (P), and (R) are projection images of Z-stacks. Epi, epidermis; Me, mesophyll; Co, cortex; En, endodermis; Cc, phloem companion cell.

