. 2014 Sep 24;3:e04235. doi: 10.7554/eLife.04235

Figure 1. PRC2 establishes H3K27me3 in ESCs independent of REST repression.

(A) A limited number of REST-occupied sites are associated with domains of H3K27me3 enrichment in ESCs, even if defined more broadly (+/− 1 kb). (B) H3K27me3 levels are stable in Rest−/− ESCs in the majority of regions targeted by PRC2. The scatter-plot shows the relative enrichment of H3K27me3 ChIP-Seq signal in wild type (WT, x-axis) and Rest−/− ESCs (y-axis) at regions targeted by PRC2 in WT ESCs. (C) As in (B), but at identified REST-binding sites. (D) Chromatin immunoprecipitation analysis showing H3K27me3-enrichment changes at RE1 sites near PRC2-targeted regions in WT and Rest−/− ESCs (* indicates p < 0.05), normalized for H3 density.

DOI: http://dx.doi.org/10.7554/eLife.04235.005

Figure 1.

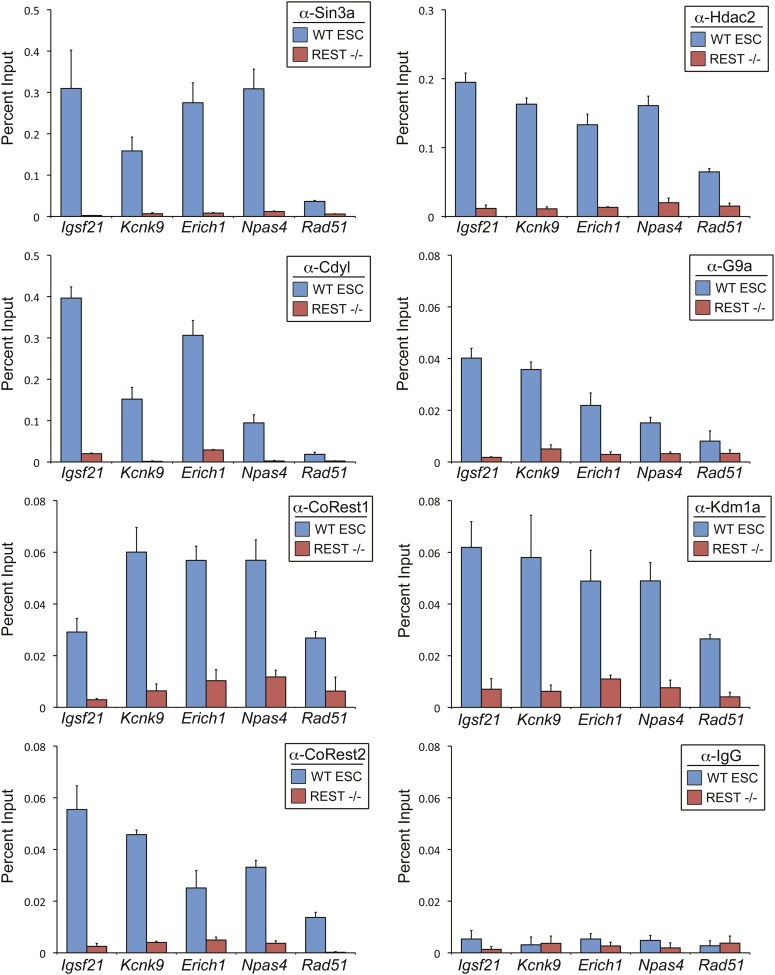
Figure 1—figure Supplement 1. REST is required for recruitment of co-factors to RE1 sites in ESCs.

Figure 1—figure Supplement 1.

ChIP assays were performed in WT and Rest−/− ESCs using antibody against Sin3a, Cdyl, CoREST1, CoREST2, Hdac2, G9a, and Kdm1a to compare recruitment of endogenous co-factors at the RE1 sites near Igsf21, Kcnk9, Erich1, Npas4, and Rad51. ChIP assays done in parallel with normal rabbit IgG are included as a negative control.
Figure 1—figure Supplement 2. Detection of REST binding to PRC2 members is biochemically possible, but a true interaction is unlikely.

Figure 1—figure Supplement 2.

(A) Immunoprecipitation was performed with streptavidin beads from biotin-tagged REST ESCs or BirA control ESCs and the demarcated proteins were assayed by Western blot. (B) Previously published ChIP-seq data sets were interrogated over H3K27me3 peaks and REST peaks normalized to the signal found at the H3K27me3 peaks.
Figure 1—figure Supplement 3. Characteristics of REST-bound loci.

Figure 1—figure Supplement 3.

(A) Regions with multiple RE1 motifs show a strong association with REST. REST ChIP-Seq data displayed as sequence tags aligned to the mouse genome assembly (mm9) viewed in the UCSC genome browser. Green and red hash marks represent sequences matching the forward and reverse strands, respectively. Consensus RE1 sequence motifs are indicated by black hash marks. All views are shown at an equal size relative to the scale bar. (B) FIMO definition of the RE1 motif was derived from ChIP-seq peaks. (C) Relative enrichment of REST measured by ChIP-Seq was confirmed by ChIP-qPCR. ChIP assays were performed using antibody raised against a peptide corresponding to a fragment of mouse REST in WT (red bars) and Rest−/− (blue bars) in ESCs at regions associated with RE1 motifs and regions lacking an RE1 site (Oct4 and MageA8). (D) REST targets associated with trimethylation of histone H3K4 or H3K27 enrichment are preferentially localized near gene promoters. Graph shows the percentage of REST-bound regions that overlap with domains of the bivalent histone modification pattern consisting of H3K4me3 and H3K27me3 enrichment (red bars), H3K4me3 enrichment alone (green bars), or without overlap to either modification (tan bars).
Figure 1—figure Supplement 4. H3K27me3 levels from WT and Rest−/− ESCs are as similar as H3K27me3 levels from different published reports.

Figure 1—figure Supplement 4.

(A) Normalized enrichment values for H3K27me3 at defined H3K27me3 peaks were derived from several previously published data sets and plotted against one another. Numbers indicate Pearson coefficient.
Figure 1—figure Supplement 5. Ezh2-enrichment at REST-bound loci.

Figure 1—figure Supplement 5.

(A) Ezh2 occupancy was increased at RE1 sites within H3K27me3 domains that gained H3K27me3 in the absence of REST. ChIP assays were performed with anti-Ezh2 to compare enrichment at RE1 sites between WT (light orange) and Rest−/− (dark orange) ESCs.