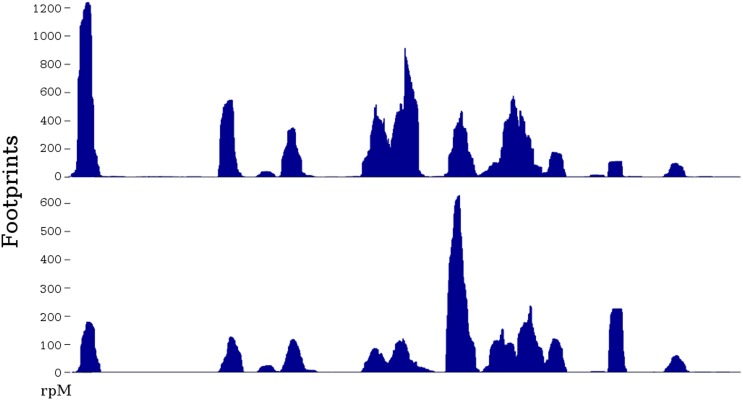
Figure 1. Two ribosome profiles of the TDH1 gene.
Top profile is from the data of Ingolia et al., 2009; bottom profile is from the SC-lys dataset (‘Materials and methods’). The first (leftmost) peak in the profiles is at the ATG start codon; it may differ in relative height because the SC-lys dataset was generated using flash-freezing.

