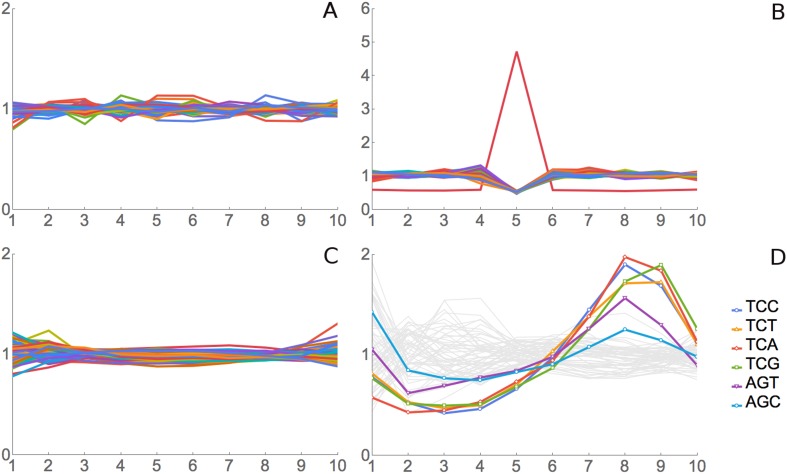
Figure 2. Validation for ribosome residence time analysis.
(A) Simulated data, negative control. Real footprint data from the SC-lys dataset were randomly assigned to codons, and RRT analysis was carried out. A flat line with an RRT value of 1 indicates no signal. (B) Simulated data, positive control. A dataset of 2 million simulated reads was generated but biased to give more reads over the codon AAA at position 6. (C) Real data, negative control. RNA-seq data from naked fragments of RNA 30 nucleotides long, processed as if for ribosome profiling, were analyzed. (D) Real data, positive control. Real ribosome footprinting data from Li et al. were analyzed (Li et al., 2012). In this experiment, E. coli were starved for serine. Note that the highest Ser peak is for TCA, which is the rarest Ser codon in E. coli, and the lowest Ser peak is for AGC, which is the most common Ser codon in E. coli. High values at position 9 as well as 8 may indicate that the A-site may be at position 8 in some fragments and position 9 in others.

