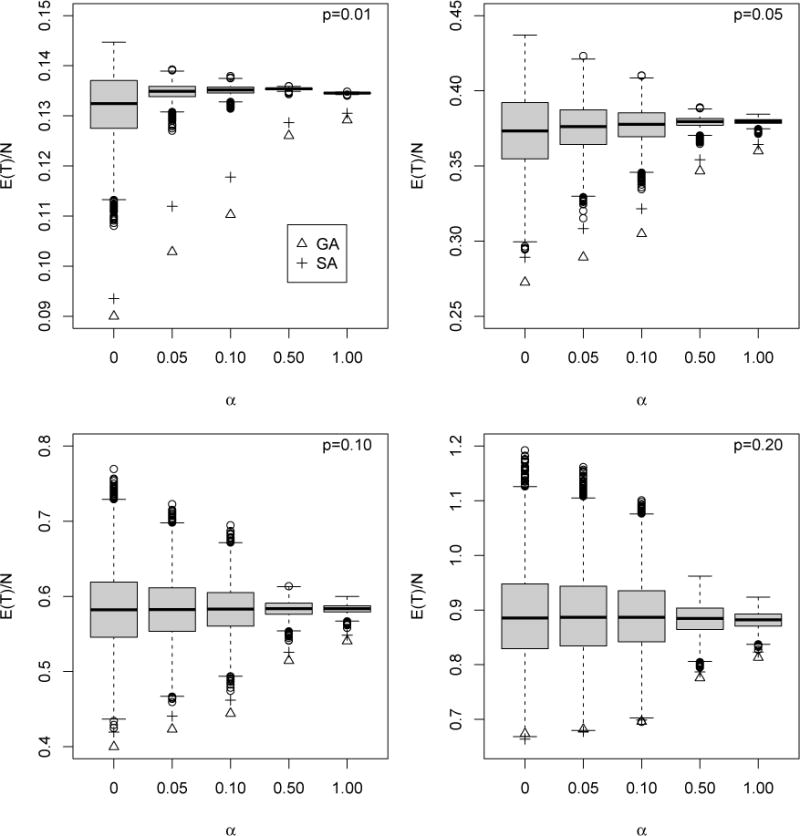
Figure 2.

Efficiency comparison with perfect testing. Box-plots of values of E(T)/N for 10, 000 randomly-selected arrangements of A. GA (∆) and SA (+) are also included. The optimal square array size K has been used for each value of p; see Hudgens and Kim (2011). Note that the vertical axis scaling is not uniform across the plots.
