
Figure 7.
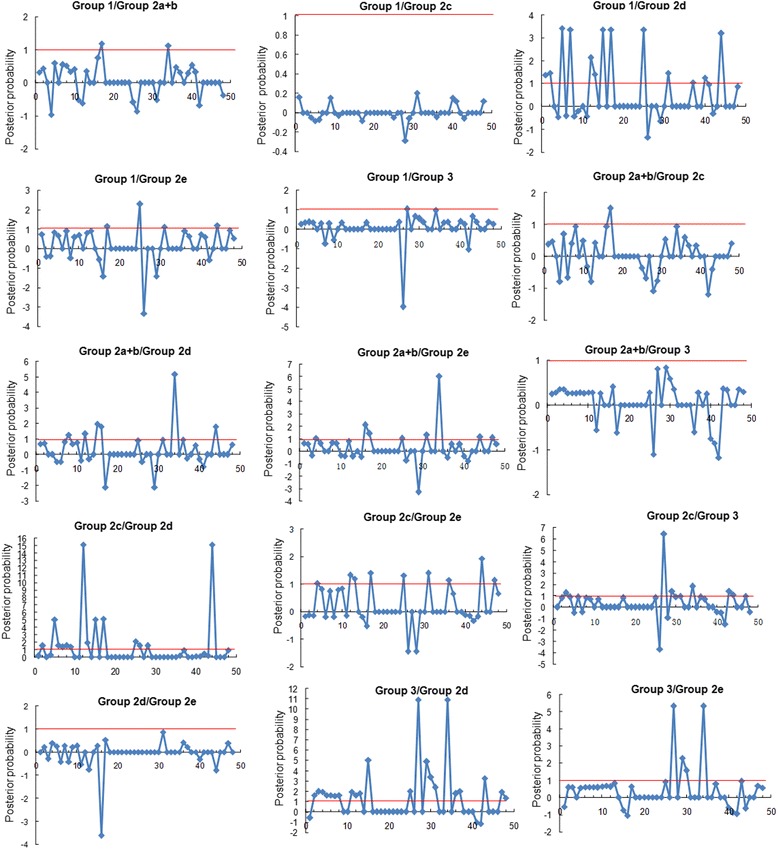
Site-specific profile for predicting critical amino acid residues responsible for the type-II functional divergence between groups of SmWRKYs. The X-axis represents locations of sites. The Y-axis represents the probability of each group. The red line indicates cutoff = 1.0.