
Figure 8.
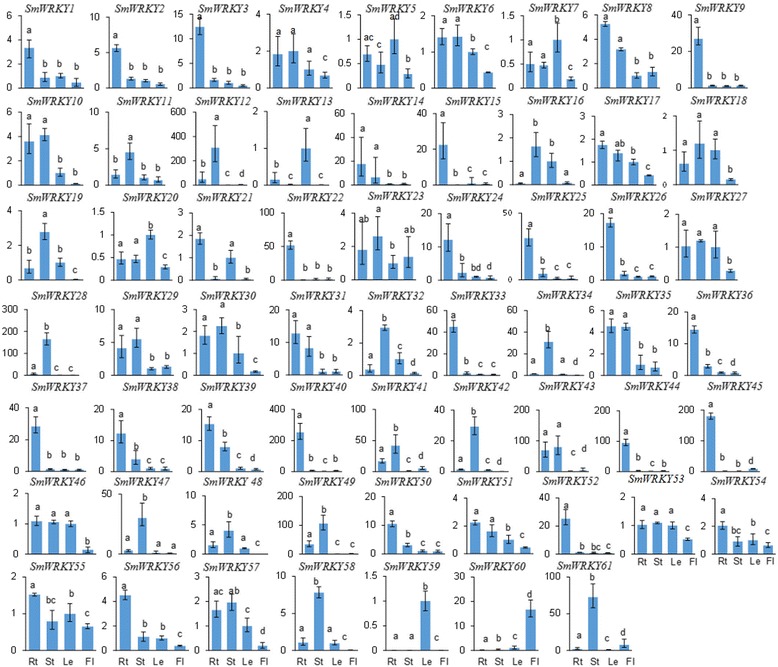
Expression patterns of SmWRKY genes in roots (Rt), stems (St), leaves (Le) and flowers (Fl) of 2-year-old, field-grown S. miltiorrhiza Bunge (line 993). The expression level of SmWRKYs was analyzed by the quantitative RT-PCR method. Y-axis indicates relative expression levels. X-axis indicates different tissues. SmUBQ10 was used as the reference gene. Transcript levels in leaves were arbitrarily set to 1 and the levels in other tissues were given relative to this. Error bars represent standard deviations of mean value from three biological and three technical replicates. ANOVA (analysis of variance) was calculated using SPSS. P < 0.05 was considered statistically significant.