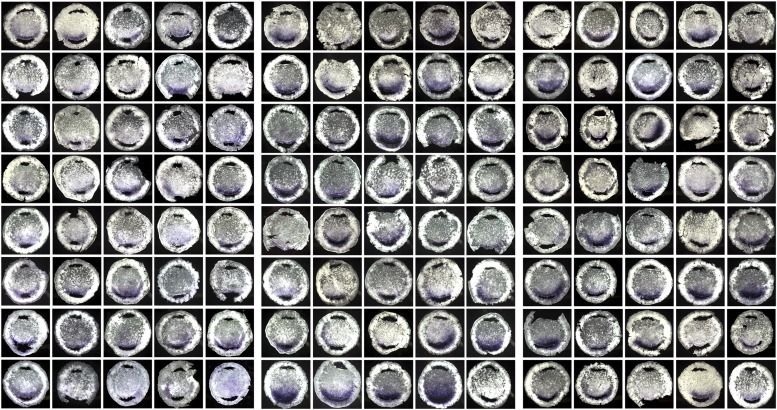
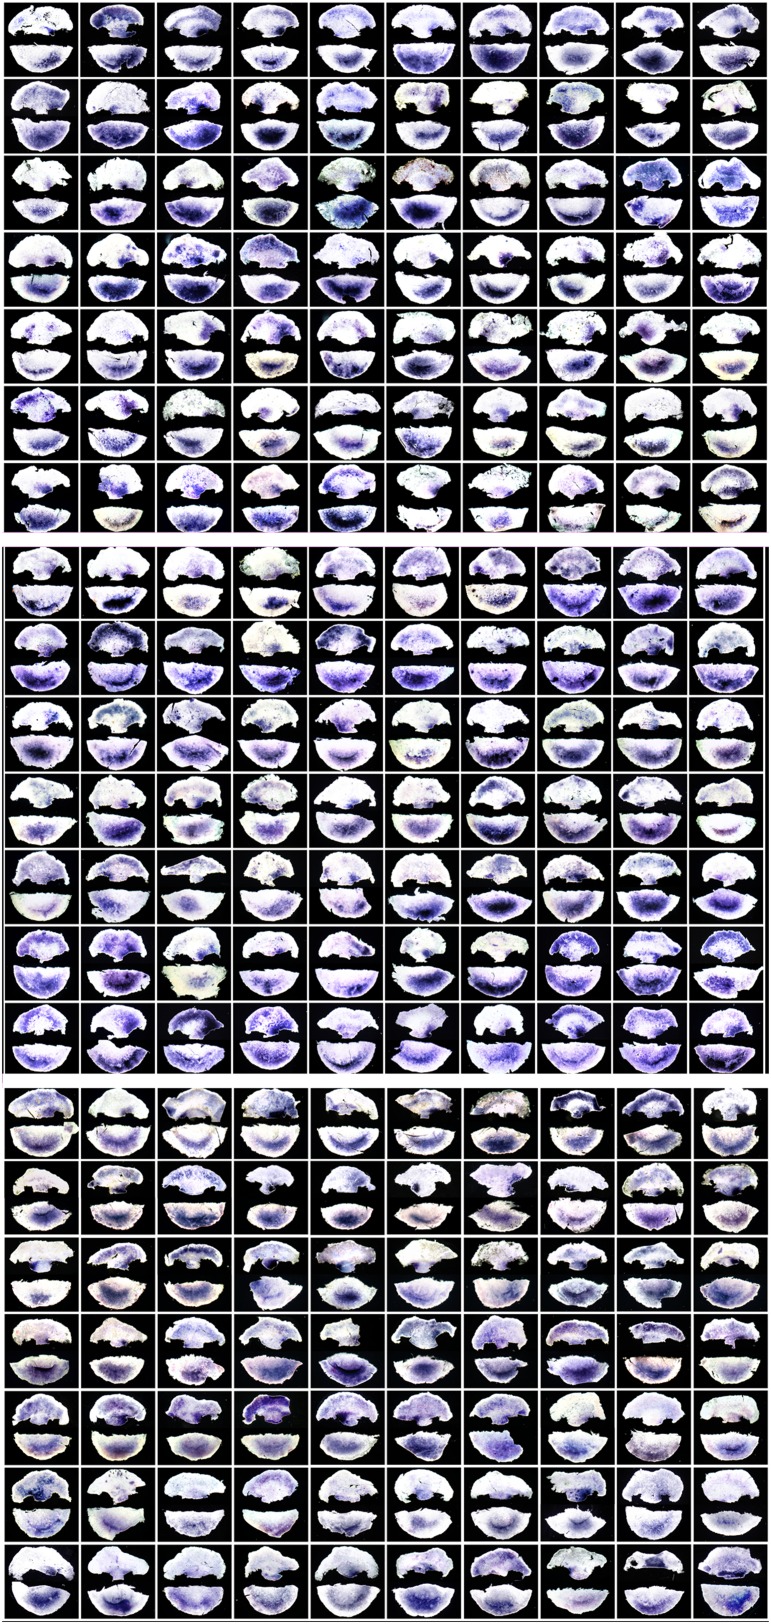
Figure 1. Microarray screens for upstream regulators of cVg1.
(A) Diagram of the first screen: the posterior marginal zone (PMZ) and anterior marginal zone (AMZ) were dissected from embryos at stage XI–XII; the remaining embryo was then fixed and stained for cVg1 by in situ hybridisation (ISH) to confirm that the explants had been obtained from the correct regions. This was done from 40 embryos for each of three biological replicates, which were then run on microarrays. The diagram is accompanied by an example of an embryo after ISH. All 120 embryos are shown in Figure 1—figure supplement 1. (B) Hierarchical clustering of differentially expressed genes for this experiment, and a plot of where cVg1-like probes (enriched in PMZ) are displayed in red and cVg1-unlike (‘downregulated’) probes shown in green across triplicate samples (A1–A3 for AMZ, P1–P3 for PMZ). The scatter plot relates normalised log2 mean signal intensities and log2 fold changes of probes from both samples (AMZ and PMZ). Probes identified as upregulated in the PMZ with a log2 fold change cut-off of 0.263 (linear fold change 1.2) are displayed in red and those identified as downregulated in the PMZ with the same cut-off are displayed in blue. (C) Diagram of the second screen. An embryo at stage XI–XII was cut in half at a right angle to the future midline; the posterior half was fixed for ISH with cVg1 to confirm the orientation (an example is shown), and the isolated anterior half cultured for 7 hr. At this point, a small explant was dissected from the marginal zone adjacent to the left and right side of the cut, and the remaining anterior half-embryo fixed for ISH with cVg1 (an example is shown). This allowed identification of the ‘cVg1-like’ and ‘cVg1-unlike’ explants, which were then pooled appropriately. This was done for 70 embryos for each of three biological replicates; all 210 posterior and anterior fragments are shown in Figure 1—figure supplement 2 after ISH for cVg1. (D) Hierarchical clustering of the probes expressed differentially in this assay, and corresponding scatter plot; details similar to (B) ≠V1, ≠V2, and ≠V3 correspond to each of the triplicate samples that do not express cVg1 and = V1, =V2, and = V3 correspond to explants that express cVg1. (E) Venn diagrams showing the intersection of upregulated and downregulated probes common to both the PMZ and isolated anterior cut halves. A total of 122 upregulated probes and 78 downregulated probes were found to be common in both experiments using both p value and fold change as the criteria. The complete dataset has been submitted to ArrayExpress where it has been assigned the Accession number E-MTAB-3116.
Figure 1—figure supplement 1. The 120 embryos used for the first screen (AMZ vs PMZ), after excision of the explants and ISH for cVg1.
Figure 1—figure supplement 2. The 210 embryos used for the second screen (lateral marginal zone from isolated anterior half embryos, cultured for 7 hr, then sorted into cVg1-like or cVg1-unlike expression).
Figure 1—figure supplement 3. Analysis of microarray datasets for posterior marginal zone (PMZ) and isolated anterior cut halves.


