
Fig. 5.
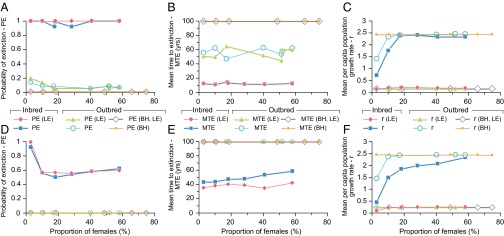
PE, MTE, and r vs. proportion of females in inbred and outbred zebrafish populations. Results from n = 100 repeat simulations for populations with two age classes (0+, 1+): PE (A), MTE (B), and mean r (C). Results for populations with three age classes (0+, 1+, 2+): PE (D), MTE (E), and mean r (F). Emergent inbreeding depression (on age 0+ survivorship) was simulated based on five LE alleles per diploid genome. Compensatory density dependence (of age 0+ survivorship) was simulated using the BH model. All scenarios were based on a maximum carrying capacity of 5,000 ± 1,000 individuals, including circa 100–200 ≥age 1+ adults capable of spawning on alternate days during the 120-d monsoon spawning season. Fecundity was 50 ± 20 eggs per female per spawn (these and other input parameter reference values and ranges are provided in SI Appendix, Table S7).