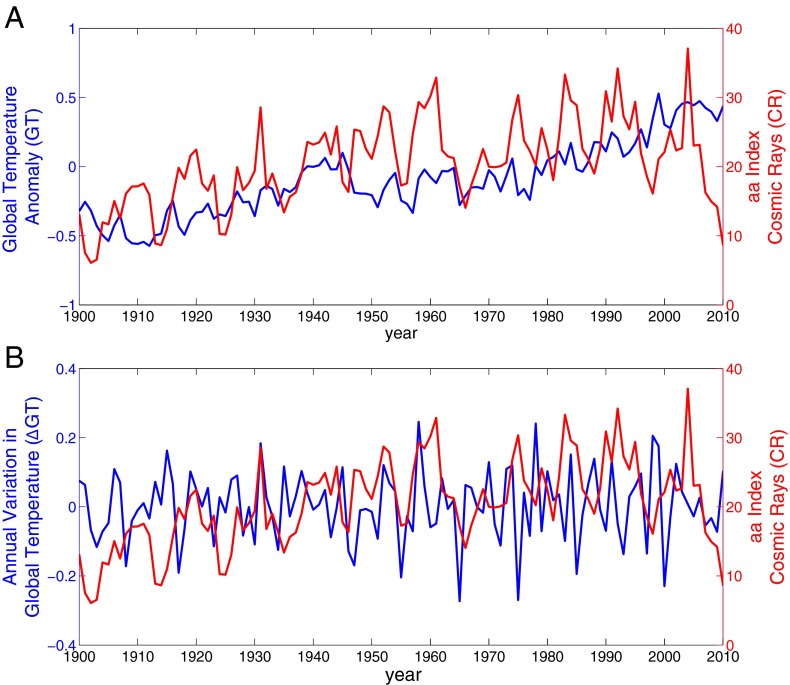
Fig. 1.
(A) Annual values for the aa index (CR proxy) and normalized GT, and (B) annual variations (first-differences) in GT (ΔGT) and CR. Despite a correlation between the CR and raw GT time series (ρ = 0.38), there is no measureable dynamic causality on the century-long timescale (Fig. 4). However, on the annual timescale, even though CR and ΔGT are not correlated (ρ = 0.02), evidence suggests they are dynamically coupled (Fig. 3).

