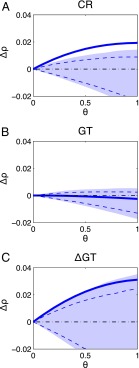
Fig. 2.
The S-map analysis of (A) the CR time series (aa proxy), (B) the GT time series, and (C) the first-differenced ΔGT time series. Δρ is the difference in the correlation between actual and predicted values between a linear model (global linear map) and an equivalent nonlinear model (local or nonlinear mappings). In a sense, it is a measure of the curvature of the manifold. Evidence for nonlinear dynamics is demonstrated if predictability improves as the S-map model parameter θ is tuned toward nonlinear solutions (θ > 0). The shaded area is the 5th/95th and the dashed blue line the 10th/90th percentile confidence intervals using surrogate data (see Data Analysis and Results). The figure shows that although CR and ΔGT both show statistical nonlinear state-dependent dynamics, the raw GT time series does not.

