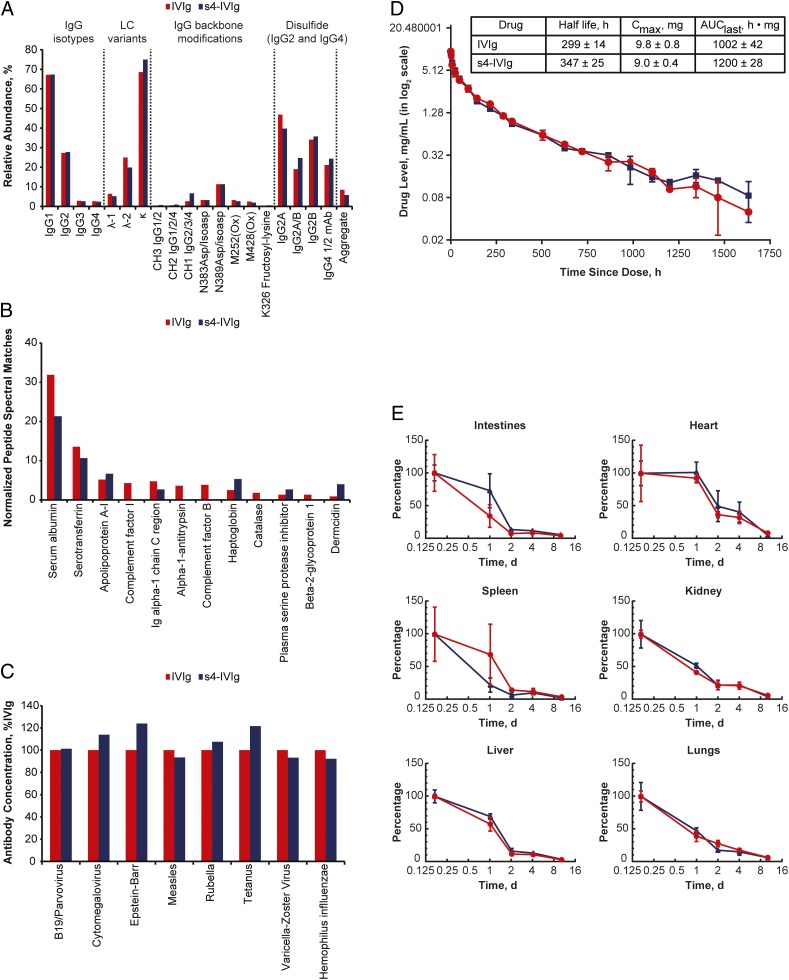
Fig. 3.
Sialylation reaction does not substantially alter the composition or the pharmacokinetics and biodistribution parameters of IVIg. IVIg is shown in red, and s4-IVIg is shown in blue. (A) Comparison of IgG protein backbone variants and posttranslational modifications for IVIg and s4-IVIg. (B) Distribution of non-IgG proteins in IVIg after depletion of IgG by protein G. Proteins other than monomeric IgG represent less than 2% of the total IVIg mixture. (C) Comparison of antigen-binding specificity for IVIg and s4-IVIg. (D) Pharmacokinetics profiles of IVIg and s4-IVIg dosed at 0.6 g/kg i.v. (E) Organ biodistribution analysis of IVIg and s4-IVIg in WT mice. AUC, area under the curve; LC, light chain.

