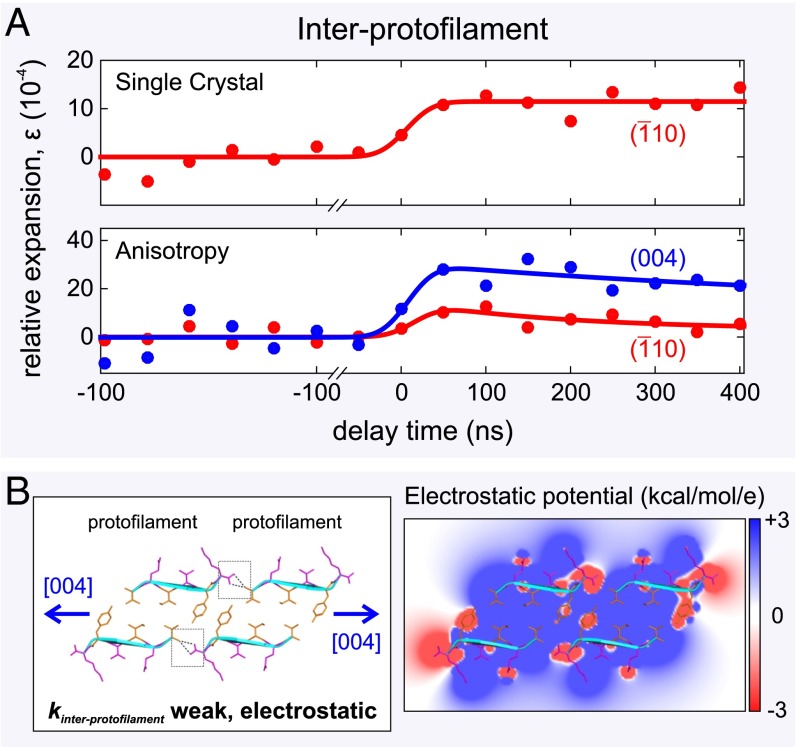
Fig. 4.
Atomic expansion dynamics of a single amyloid-like microcrystal measured using 4D electron microscopy. (A) The single 3D microcrystal displays an expansion of the β-sheets of 11 4.0, whereas the dynamics along the [0 0 4] direction shows that there is a much larger expansion of 28 8.0 in the interprotofilament direction. (B, Left) Schematic of the expansion of the protofilament–protofilament interface with the stabilizing bifurcated hydrogen bonds (dashed black lines) highlighted by two gray boxes. Individual β-strands are shown as cyan ribbons. (B, Right) A cross-section of the electrostatic potential surface of the protofilament–protofilament complex is shown ranging from +3 kcal⋅mol−1 per electron (blue) to −3 kcal⋅mol−1 per electron (red), with white representing uncharged regions of the constituent peptides. For clarity, an overlaid ribbon and stick representation makes individual sidechains more identifiable. The cross-β structure was created using PDB ID code 3OVL.

