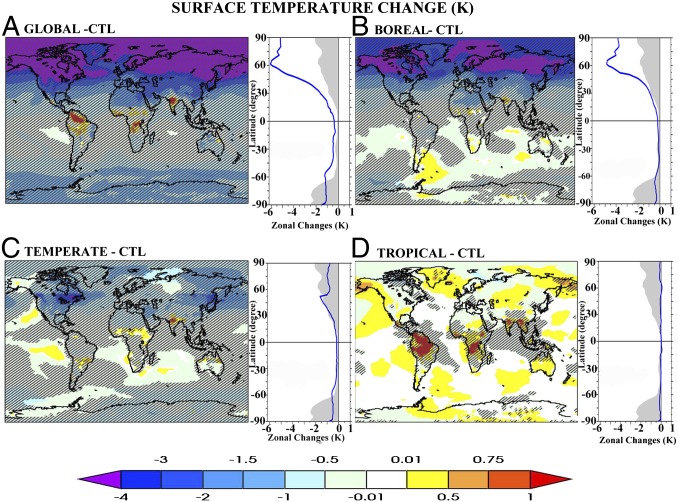
Fig. 1.
Changes in annual mean surface temperature between the deforestation experiments and the control simulation over the last 50 y of the 80-y simulations. (A) Global, (B) Boreal, (C) Temperate, and (D) Tropical. Hatched areas are regions where changes are statistically significant at the 95% confidence level. Significance level is estimated using a Student’s t test with a sample of 50 annual mean differences and SE corrected for temporal serial correlation (51). Line plots show the zonal mean surface temperature changes. Shading in line plots represents the one SD estimated from the control simulation. Temperature changes in all panels indicate a larger local effect of deforestation.

