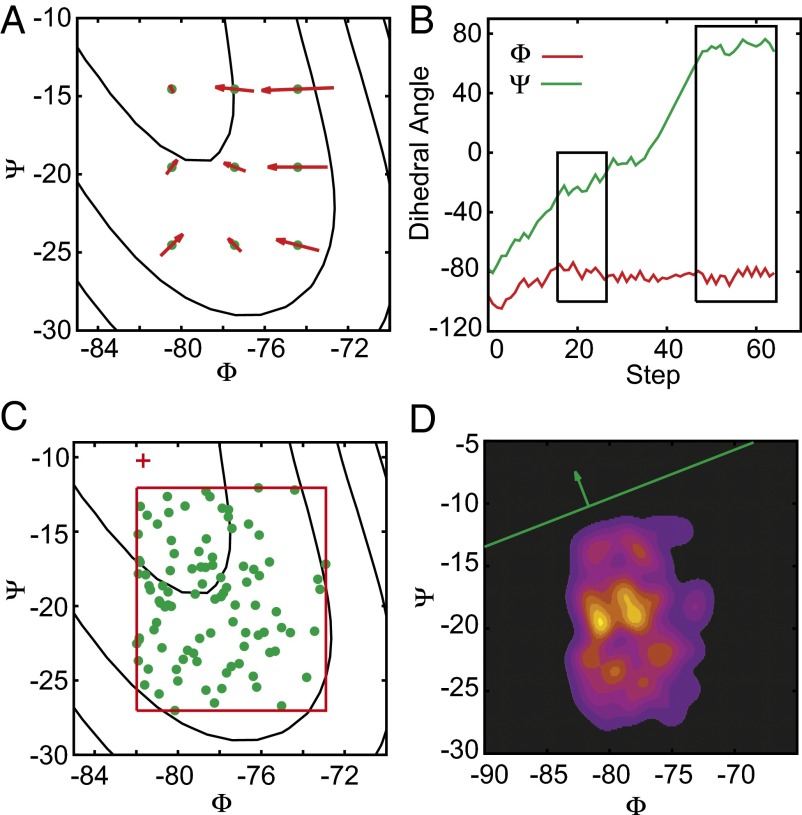
Fig. 1.
A flat region (M4, Fig. 2) on the Ramachandran plot of the alanine dipeptide in vacuum is studied in detail. (A) A benchmark study proves that this region is not a minimum. The red arrows are the mean force at the green lattice points. (B) One minimum optimization trajectory passes through this range and ultimately forms a cluster at another minimum. (C) Samples in this flat region are the green points, and the background FES is from a 10-ns UFED (8) simulation. The red cross is the fitted critical point. (D) The starting point of the green arrow is the fitted critical point. The green line is the plane of maximum separation and the green arrow is its normal vector. The convolved samples are plotted as the colored density distribution in the background. The light yellow color indicates the largest density and the black color shows the low-density regions.

