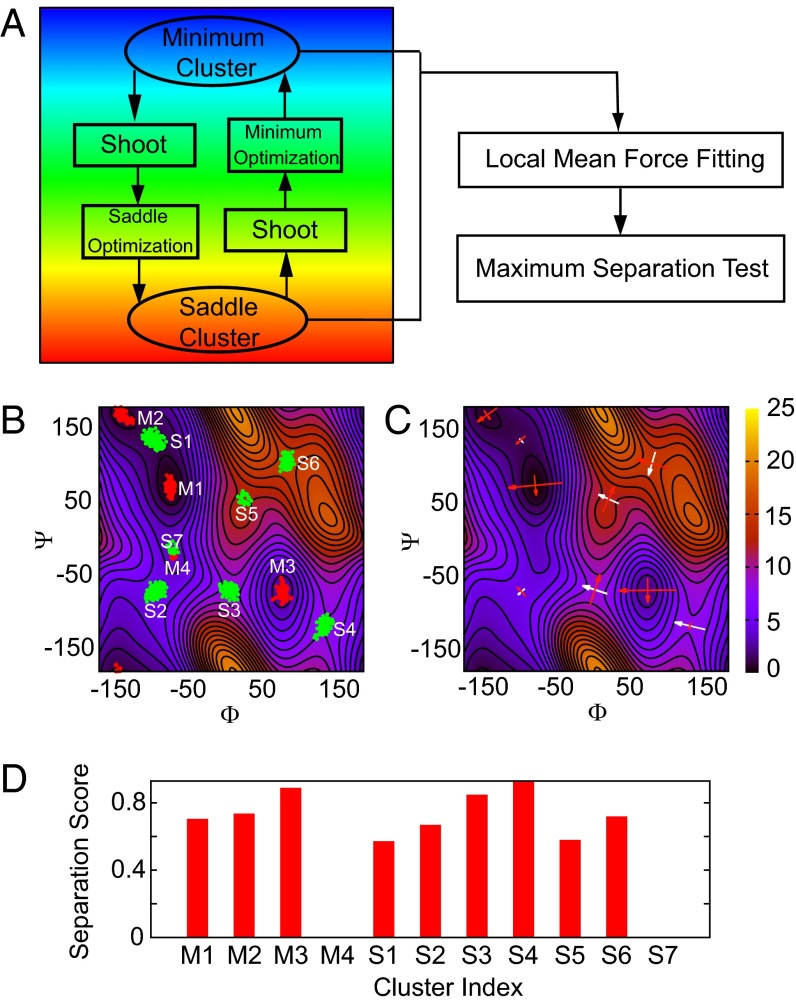
Fig. 2.
(A) Flowchart of the START procedure. First, an optimization is performed to drive the system to the nearest minimum from an initial configuration. Following this, a trajectory is shot along a random direction for several steps. A saddle optimization is then started and terminated if it is converged. Finally, a trajectory is shot again along another random direction, and a new minimum optimization is initiated. One such loop, including one minimum and saddle point optimization, is considered an iteration. All clusters are then sent to a local mean force fitting and maximum separation testing for identifying and locating landmarks. (B) Samples from the START simulation are aggregated as clusters. Red samples are minima candidates and green samples are saddle candidates. (C) The eigenvectors of each minimum/saddle are two perpendicular arrows crossing at the exact location of the minimum/saddle. The length of an arrow is proportional to the magnitude of the corresponding eigenvalue, and the color indicates the sign of the eigenvalue: Red is positive, and white is negative. (D) The scores (l) of the maximum separation test clearly prove that the M4 and S7 clusters are flat regions rather than true minima/saddles.

