
Fig. 2.
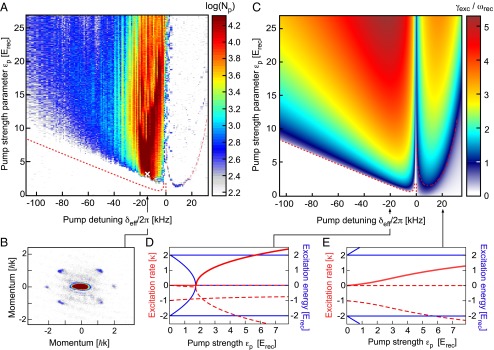
(A) Observed intracavity photon number is plotted versus the pump strength parameter and the pump detuning . (B) A momentum spectrum is shown recorded at the point in A marked by the white cross. The dashed red line indicates the equilibrium Dicke phase boundary obtained from the stability analysis illustrated in C. (C) Plot of the maximal excitation rate calculated from a stability analysis for the homogeneous phase of the Dicke model. For negative , the equilibrium Dicke phase transition line is highlighted by the red dashed line. For positive , the dashed-dotted red line indicates the contour , where superradiant pulses are observed in A. (D and E) For kHz the real (solid blue lines) and imaginary (dashed red lines) parts of all eigenvalues of the stability matrix are plotted. The maximal values of the latter are highlighted by the solid red lines.