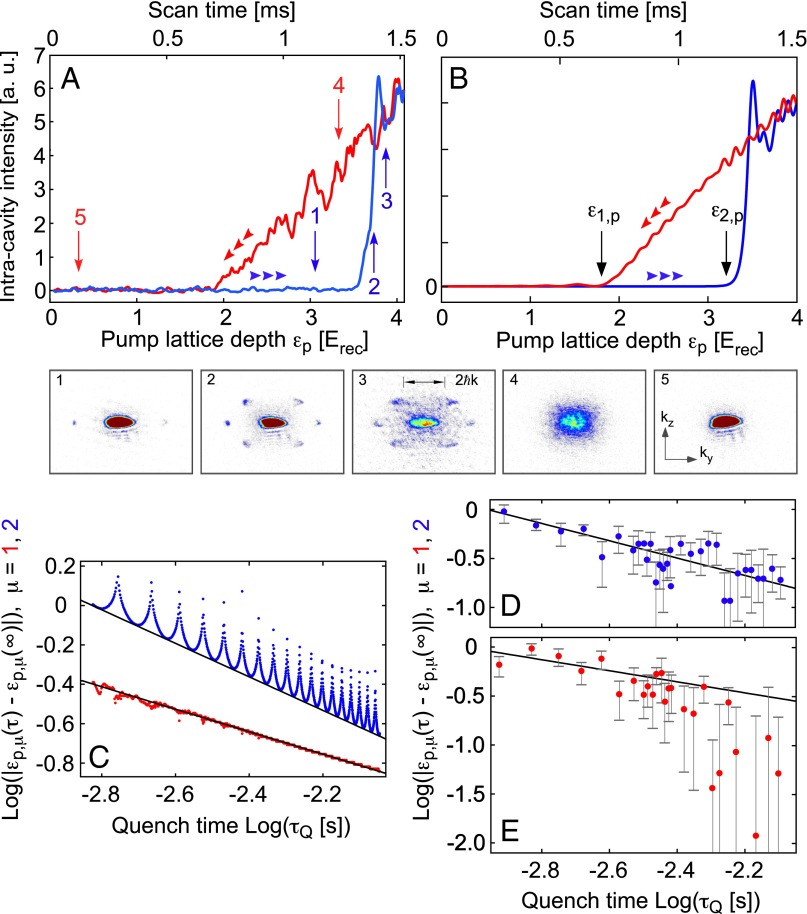
Fig. 3.
(A) For fixed kHz the intracavity intensity is plotted with the pump strength ramped from 0 to in 1.5 ms (blue line) and back (red line). Below A, a series of consecutively numbered momentum spectra is shown (1–5), recorded at increasing times during the -ramp, indicated by the correspondingly numbered arrows in A. (B) Mean-field calculation according to A for a homogeneous, infinite system without collisional interaction. (C) Mean-field calculations of (Lower, red dots) and (Upper, blue dots) are shown. The solid lines show power laws with exponents (Lower) and (Upper). The measured dependence of the critical values upon the quench time is shown for in D and for in E. The solid lines repeat the power laws found in the mean-field calculations in C. The error bars reflect the SDs for 10 measurements.

